

Answered step by step
Verified Expert Solution
Question
1 Approved Answer
PLEASE ANSWER THIS QUESTION BY COMMENTING ABOUT THE COMPANY AMERICAN AIRLINES' FINANCIAL STATEMENT FOR THE PAST 5 YEARS! QUOTES & COMPANIES VIEW ALL COMPANIES REAL
PLEASE ANSWER THIS QUESTION BY COMMENTING ABOUT THE COMPANY AMERICAN AIRLINES' FINANCIAL STATEMENT FOR THE PAST 5 YEARS!
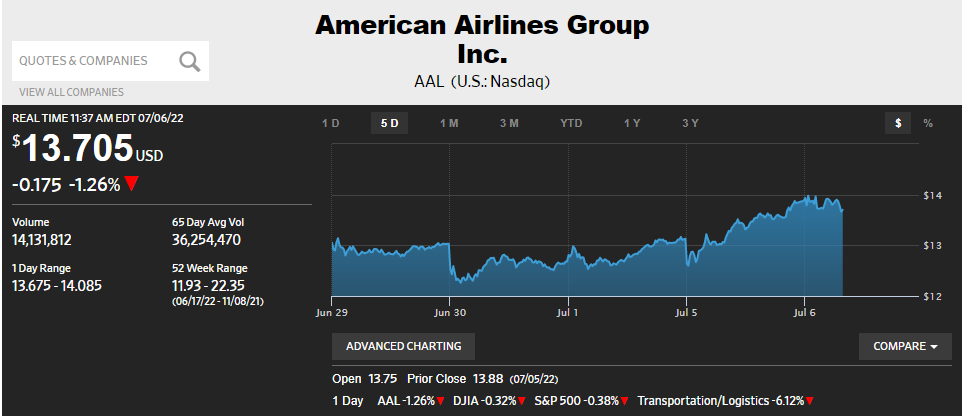
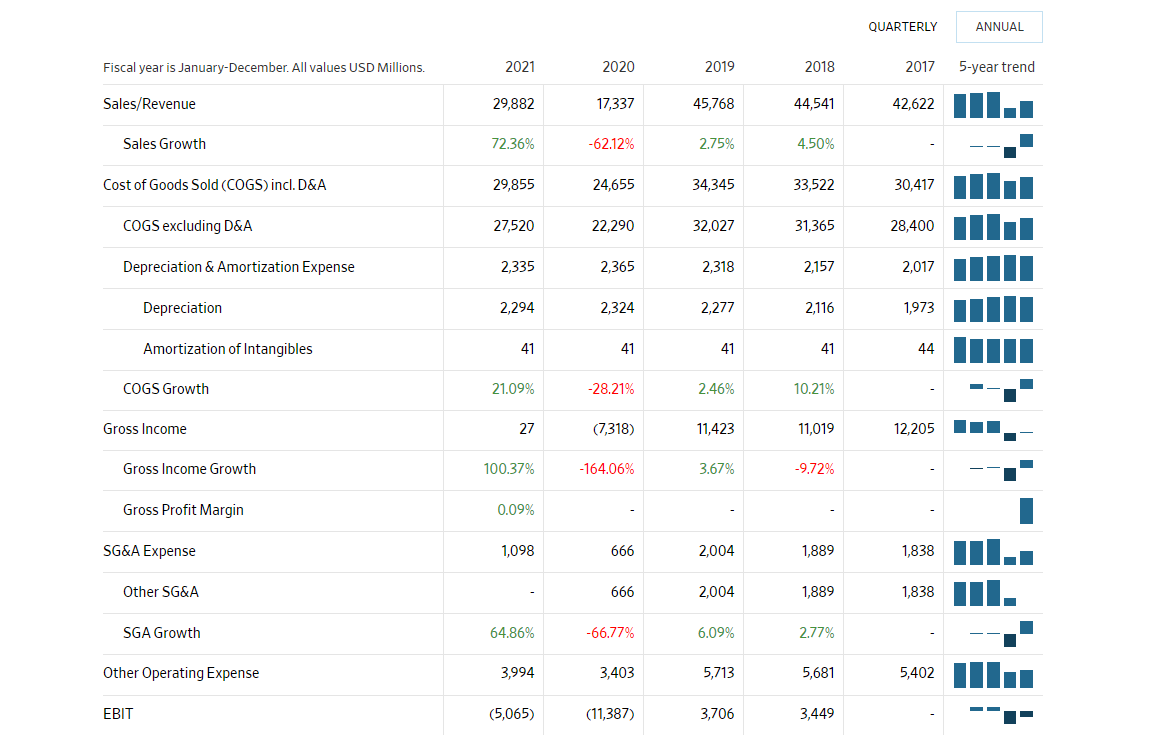
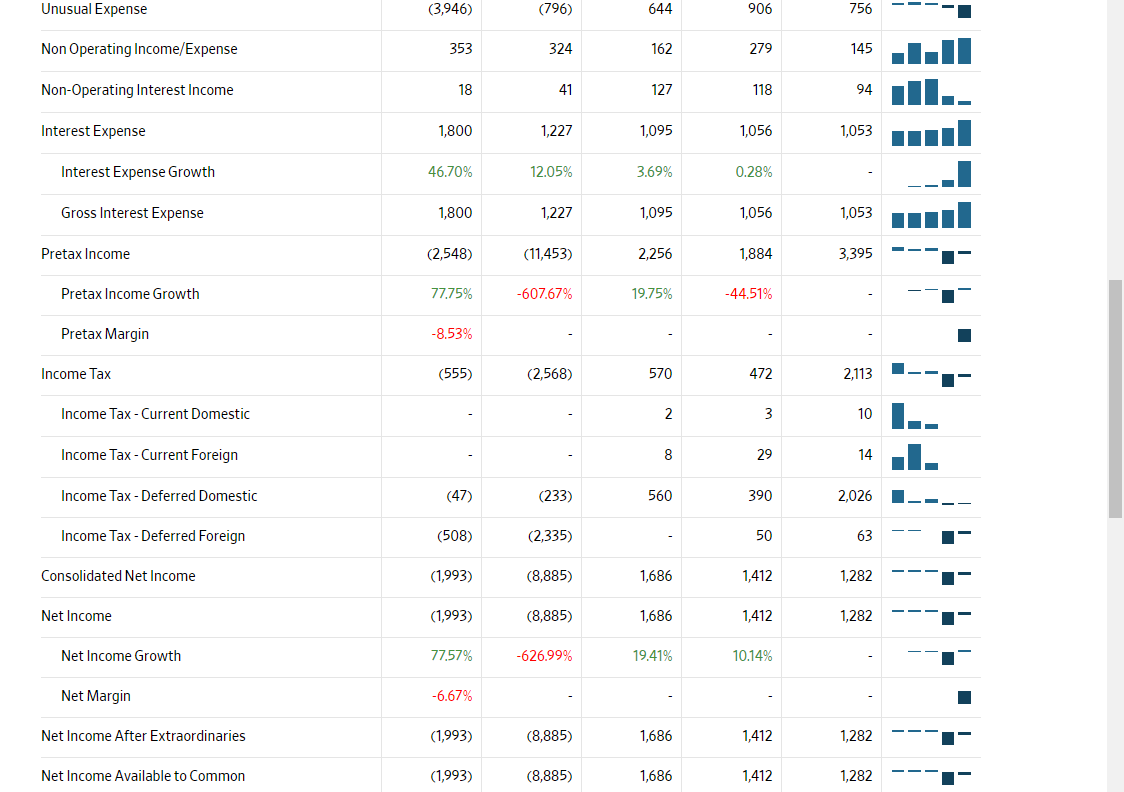
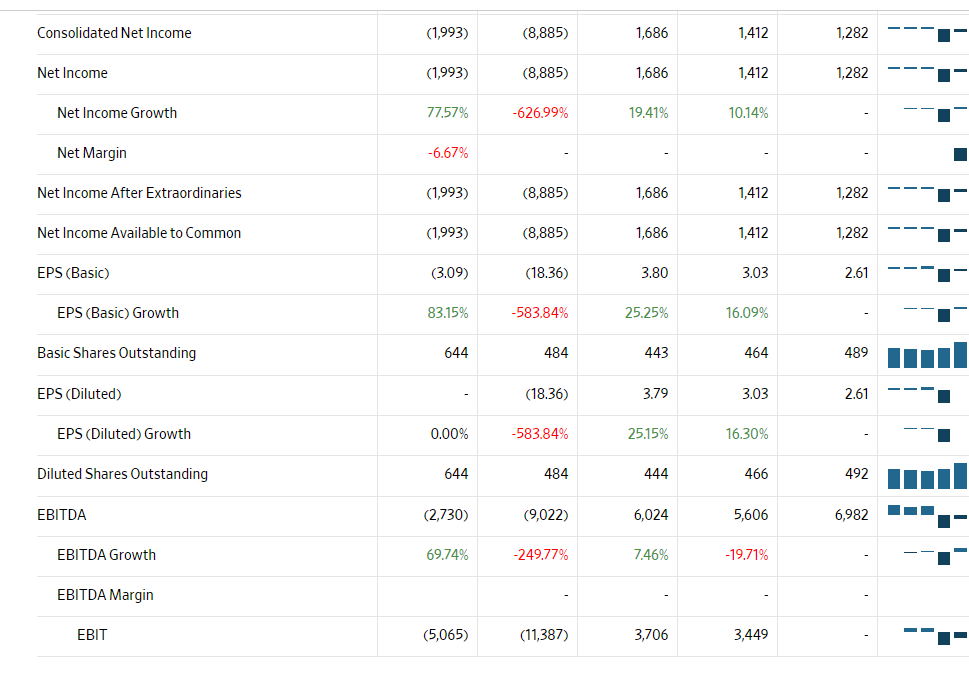
QUOTES & COMPANIES VIEW ALL COMPANIES REAL TIME 11:37 AM EDT 07/06/22 $13.705 USD -0.175 -1.26% Volume 14,131,812 1 Day Range 13.675-14.085 65 Day Avg Vol 36,254,470 52 Week Range 11.93-22.35 (06/17/22-11/08/21) American Airlines Group Inc. AAL (U.S.: Nasdaq) 1 D Jun 29 5 D 1 M Jun 30 ADVANCED CHARTING 3 M YTD Jul 1 1 Y 3 Y Jul 5 Jul 6 Open 13.75 Prior Close 13.88 (07/05/22) 1 Day AAL-1.26% DJIA -0.32% S&P 500-0.38% Transportation/Logistics -6.12% $ $14 $13 $12 COMPARE Fiscal year is January-December. All values USD Millions. Sales/Revenue Sales Growth Cost of Goods Sold (COGS) incl. D&A COGS excluding D&A Depreciation & Amortization Expense Depreciation Amortization of Intangibles COGS Growth Gross Income Gross Income Growth Gross Profit Margin SG&A Expense Other SG&A SGA Growth EBIT Other Operating Expense 2021 29,882 72.36% 29,855 27,520 2,335 2,294 41 21.09% 27 100.37% 0.09% 1,098 64.86% 3,994 (5,065) 2020 17,337 -62.12% 24,655 22,290 2,365 2,324 41 -28.21% (7,318) -164.06% . 666 666 -66.77% 3,403 (11,387) 2019 45,768 2.75% 34,345 32,027 2,318 2,277 41 2.46% 11,423 3.67% 2,004 2,004 6.09% 5,713 3,706 2018 44,541 4.50% 33,522 31,365 2,157 2,116 41 10.21% 11,019 -9,72% 1,889 1,889 2.77% 5,681 3,449 QUARTERLY 2017 42,622 30,417 28,400 2,017 1,973 44 12,205 1,838 1,838 5,402 ANNUAL 5-year trend Unusual Expense Non Operating Income/Expense Non-Operating Interest Income Interest Expense Interest Expense Growth Gross Interest Expense Pretax Income Pretax Income Growth Pretax Margin Income Tax Income Tax - Current Domestic Income Tax - Current Foreign Income Tax - Deferred Domestic Income Tax - Deferred Foreign Consolidated Net Income Net Income Net Income Growth Net Margin Net Income After Extraordinaries Net Income Available to Common (3,946) 353 18 1,800 46.70% 1,800 (2,548) 77.75% -8.53% (555) (47) (508) (1,993) (1,993) 77.57% -6.67% (1,993) (1,993) (796) 324 41 1,227 12.05% 1,227 (11,453) -607.67% (2,568) (233) (2,335) (8,885) (8,885) -626.99% (8,885) (8,885) 644 162 127 1,095 3.69% 1,095 2,256 19.75% 570 2 8 560 1,686 1,686 19.41% 1,686 1,686 906 279 118 1,056 0.28% 1,056 1,884 -44.51% 472 3 29 390 50 1,412 1,412 10.14% 1,412 1,412 756 145 94 1,053 1,053 3,395 2,113 10 14 2,026 63 1,282 1,282 1,282 1,282 Consolidated Net Income Net Income Net Income Growth Net Margin Net Income After Extraordinaries Net Income Available to Common EPS (Basic) EPS (Basic) Growth Basic Shares Outstanding EPS (Diluted) EPS (Diluted) Growth Diluted Shares Outstanding EBITDA EBITDA Growth EBITDA Margin EBIT (1,993) (1,993) 77.57% -6.67% (1,993) (1,993) (3.09) 83.15% 644 0.00% 644 (2,730) 69.74% (5,065) (8,885) (8,885) -626.99% (8,885) (8,885) (18.36) -583.84% 484 (18.36) -583.84% 484 (9,022) -249.77% (11,387) 1,686 1,686 19.41% 1,686 1,686 3.80 25.25% 443 3.79 25.15% 444 6,024 7.46% 3,706 1,412 1,412 10.14% 1,412 1,412 3.03 16.09% 464 3.03 16.30% 466 5,606 -19,71% 3,449 1,282 1,282 1,282 1,282 2.61 489 2.61 492 6,982 H
Step by Step Solution
There are 3 Steps involved in it
Step: 1

Get Instant Access to Expert-Tailored Solutions
See step-by-step solutions with expert insights and AI powered tools for academic success
Step: 2

Step: 3
Ace Your Homework with AI
Get the answers you need in no time with our AI-driven, step-by-step assistance
Get Started
Financial Trading And Investing
Authors: John Teall
1st Edition
0123918804, 978-0123918802