

Question: Please answer urgently, the csv.file is provided in the last two photos. I will give thumbs up and leave a great comment! Thank you so
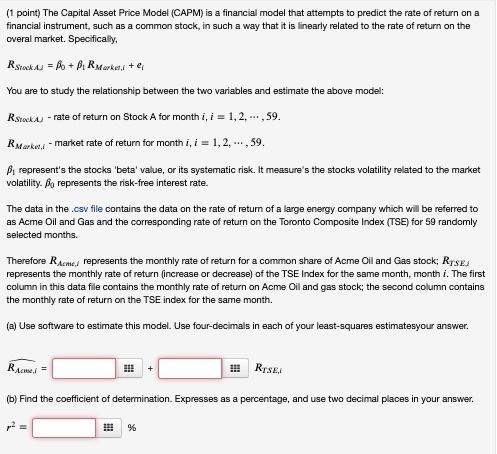
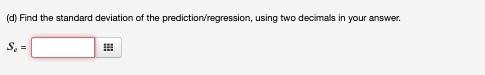
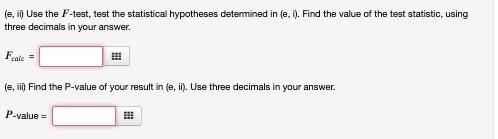
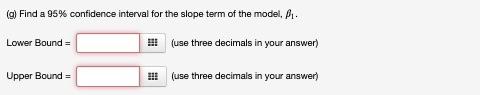
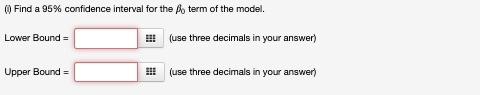
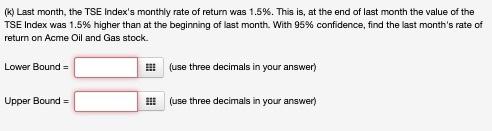
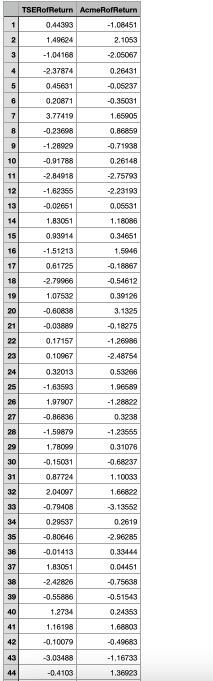
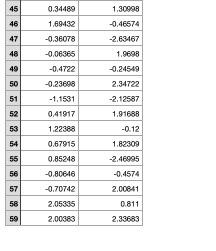
(1 point) The Capital Asset Price Model (CAPM) is a financial model that attempts to predict the rate of return on a financial instrument, such as a common stock, in such a way that it is linearly related to the rate of return on the overal market. Specifically Rstock = lo + BR Market, + e You are to study the relationship between the two variables and estimate the above model: Rstock - rate of return on Stock A for month i, i = 1,2...., 59. RMarker - market rate of return for month i, i = 1, 2, ..., 59. By represents the stocks 'beta' value, or its systematic risk. It measure's the stocks volatility related to the market volatility. Bio represents the risk-free interest rate. The data in the cav file contains the data on the rate of return of a large energy company which will be referred to as Acme Oil and Gas and the corresponding rate of return on the Toronto Composite Index (TSE) for 59 randomly selected months. Therefore Rame represents the monthly rate of return for a common share of Acme Oil and Gas stock, Rrses represents the monthly rate of return (increase or decrease) of the TSE Index for the same month, month i. The first column in this data file contains the monthly rate of return on Acme Oil and gas stock; the second column contains the monthly rate of return on the TSE index for the same month. (a) Use software to estimate this model. Use four-decimals in each of your least-squares estimatesyour answer. RAN = + RISE (b) Find the coefficient of determination. Expresses as a percentage, and use two decimal places in your answer. p? 183 %% (d) Find the standard deviation of the prediction/regression, using two decimals in your answer. S = !!! (e, in Use the F-test, test the statistical hypotheses determined in (e. i). Find the value of the test statistic, using three decimals in your answer. Fale = (e, vil) Find the P-value of your result in (e. ii). Use three decimals in your answer. P-value = (g) Find a 95% confidence interval for the slope term of the model. .. Lower Bound = (use three decimals in your answer) Upper Bound (use three decimals in your answer) Find a 95% confidence interval for the fo term of the model. Lower Bound = ! (use three decimals in your answer) Upper Bound = (use three decimals in your answer) (k) Last month, the TSE Index's monthly rate of return was 1.5%. This is, at the end of last month the value of the TSE Index was 1.5% higher than at the beginning of last month. With 95% confidence, find the last month's rate of return on Acme Oil and Gas stock. Lower Bound = (use three decimals in your answer) Upper Bound !!! (use three decimals in your answer) TSERofReturn AemeRofReturn 1 2 0.44393 1.49624 -1.64168 -1.08451 2. 1053 -2.05067 3 4 -2.37874 5 0.45631 6 0.20871 3.77419 0.26431 -0.05237 -0.35031 1.65905 0.86859 -0.71938 7 8 -0.23698 9 -1.28929 10 0.26148 -0.91788 -2.84918 11 -2.75793 -2.23193 12 15 -1.62355 -0.02651 1.83051 0.93914 -1.51213 0.61725 -2.79966 1.07532 0.05531 1.18086 0.34651 1.5946 -0.18867 -0.54612 16 17 18 19 20 21 -0.60838 -0.03889 0.17157 23 0.10967 0.39126 3.1325 -0.18275 -1.26986 -2.48754 0.53286 1.96589 -1.28822 0.3238 -1.23565 24 0.32013 25 -1.63593 1.97907 -0.86836 27 28 -1.59879 29 1.78099 0.31078 -0.68237 30 -0.15031 31 0.87724 1.10033 32 2.04097 1.66822 33 -0.79408 34 0.29537 35 0.2619 -2.96285 0.33144 36 37 0.04451 -0.80616 -0.01413 1.83051 -2.42826 -0.55886 1.2734 38 39 -0.75638 -0.51543 0.24353 40 41 1.16198 1.68803 -0.49683 42 43 -0.10079 -3.03488 -0.4103 -1,16733 1.36923 44 0.34489 1,69432 -0.36078 45 46 47 48 49 50 -0.06365 -0.4722 -0.23698 51 -1.1531 52 1.30098 -0.46674 -2.63467 1.9698 -0.24549 2.34722 -2.12587 1.91688 -0.12 1.82309 -2.46995 -0.4574 2.00641 0.811 2.33683 0.41917 1.22388 0.67915 0.85248 -0.HTF-16 -0.70742 2.05335 2.00383 8 82 57 58 59 (1 point) The Capital Asset Price Model (CAPM) is a financial model that attempts to predict the rate of return on a financial instrument, such as a common stock, in such a way that it is linearly related to the rate of return on the overal market. Specifically Rstock = lo + BR Market, + e You are to study the relationship between the two variables and estimate the above model: Rstock - rate of return on Stock A for month i, i = 1,2...., 59. RMarker - market rate of return for month i, i = 1, 2, ..., 59. By represents the stocks 'beta' value, or its systematic risk. It measure's the stocks volatility related to the market volatility. Bio represents the risk-free interest rate. The data in the cav file contains the data on the rate of return of a large energy company which will be referred to as Acme Oil and Gas and the corresponding rate of return on the Toronto Composite Index (TSE) for 59 randomly selected months. Therefore Rame represents the monthly rate of return for a common share of Acme Oil and Gas stock, Rrses represents the monthly rate of return (increase or decrease) of the TSE Index for the same month, month i. The first column in this data file contains the monthly rate of return on Acme Oil and gas stock; the second column contains the monthly rate of return on the TSE index for the same month. (a) Use software to estimate this model. Use four-decimals in each of your least-squares estimatesyour answer. RAN = + RISE (b) Find the coefficient of determination. Expresses as a percentage, and use two decimal places in your answer. p? 183 %% (d) Find the standard deviation of the prediction/regression, using two decimals in your answer. S = !!! (e, in Use the F-test, test the statistical hypotheses determined in (e. i). Find the value of the test statistic, using three decimals in your answer. Fale = (e, vil) Find the P-value of your result in (e. ii). Use three decimals in your answer. P-value = (g) Find a 95% confidence interval for the slope term of the model. .. Lower Bound = (use three decimals in your answer) Upper Bound (use three decimals in your answer) Find a 95% confidence interval for the fo term of the model. Lower Bound = ! (use three decimals in your answer) Upper Bound = (use three decimals in your answer) (k) Last month, the TSE Index's monthly rate of return was 1.5%. This is, at the end of last month the value of the TSE Index was 1.5% higher than at the beginning of last month. With 95% confidence, find the last month's rate of return on Acme Oil and Gas stock. Lower Bound = (use three decimals in your answer) Upper Bound !!! (use three decimals in your answer) TSERofReturn AemeRofReturn 1 2 0.44393 1.49624 -1.64168 -1.08451 2. 1053 -2.05067 3 4 -2.37874 5 0.45631 6 0.20871 3.77419 0.26431 -0.05237 -0.35031 1.65905 0.86859 -0.71938 7 8 -0.23698 9 -1.28929 10 0.26148 -0.91788 -2.84918 11 -2.75793 -2.23193 12 15 -1.62355 -0.02651 1.83051 0.93914 -1.51213 0.61725 -2.79966 1.07532 0.05531 1.18086 0.34651 1.5946 -0.18867 -0.54612 16 17 18 19 20 21 -0.60838 -0.03889 0.17157 23 0.10967 0.39126 3.1325 -0.18275 -1.26986 -2.48754 0.53286 1.96589 -1.28822 0.3238 -1.23565 24 0.32013 25 -1.63593 1.97907 -0.86836 27 28 -1.59879 29 1.78099 0.31078 -0.68237 30 -0.15031 31 0.87724 1.10033 32 2.04097 1.66822 33 -0.79408 34 0.29537 35 0.2619 -2.96285 0.33144 36 37 0.04451 -0.80616 -0.01413 1.83051 -2.42826 -0.55886 1.2734 38 39 -0.75638 -0.51543 0.24353 40 41 1.16198 1.68803 -0.49683 42 43 -0.10079 -3.03488 -0.4103 -1,16733 1.36923 44 0.34489 1,69432 -0.36078 45 46 47 48 49 50 -0.06365 -0.4722 -0.23698 51 -1.1531 52 1.30098 -0.46674 -2.63467 1.9698 -0.24549 2.34722 -2.12587 1.91688 -0.12 1.82309 -2.46995 -0.4574 2.00641 0.811 2.33683 0.41917 1.22388 0.67915 0.85248 -0.HTF-16 -0.70742 2.05335 2.00383 8 82 57 58 59
Step by Step Solution
There are 3 Steps involved in it

Get step-by-step solutions from verified subject matter experts