please

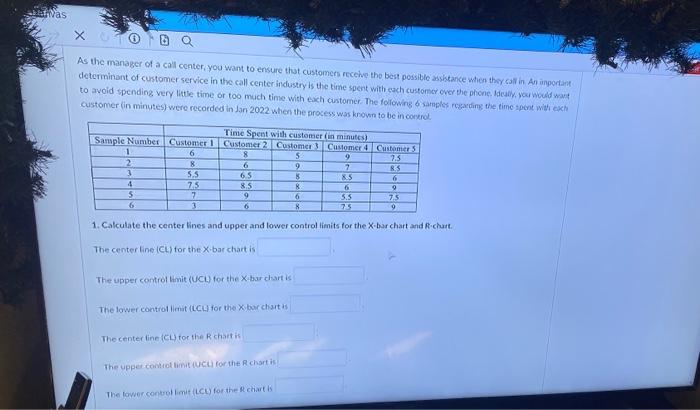
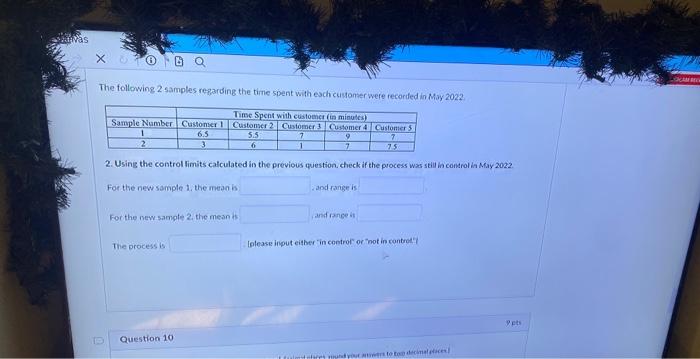
As the manager of a coll center, you want to ensure that customers recehe tho best possible absibtance when thoycal in An aingortant determinant of customer service in the call center industry is the time spent with cach custonser ever bhe phicne, ldealiy, yau beuld wain to avoid spending very litte time or too much time with exch cuntomer. The folowirg o sarmples rogarding the time apent will exh customer (in minutes) were recorded in J.3n2022 when the process was krows to be in conem. 1. Calculate the center lines and upper and lower control limits for the X-bar chart and f-churt. The center line (CL) for the X.bar chart is The upper control hmit (UCL) for the Xibur chart is The lower control limat (LCL) for the Xbor chist is The center line (CL) tor the R chait is The upper contat limit vectil forthe Renart is The fowercontoll limit (LCU) for the M chart is The follonving 2 samples regarding the time spent with each custonser were tecorfed in May 2022 2. Using the control limits calculated in the previous question, check if the process was still in control in May 202 For the new sample 1. the mean is For the new sampte 2 , the mean is The process is [olease input either in controc or inot in contone? As the manager of a coll center, you want to ensure that customers recehe tho best possible absibtance when thoycal in An aingortant determinant of customer service in the call center industry is the time spent with cach custonser ever bhe phicne, ldealiy, yau beuld wain to avoid spending very litte time or too much time with exch cuntomer. The folowirg o sarmples rogarding the time apent will exh customer (in minutes) were recorded in J.3n2022 when the process was krows to be in conem. 1. Calculate the center lines and upper and lower control limits for the X-bar chart and f-churt. The center line (CL) for the X.bar chart is The upper control hmit (UCL) for the Xibur chart is The lower control limat (LCL) for the Xbor chist is The center line (CL) tor the R chait is The upper contat limit vectil forthe Renart is The fowercontoll limit (LCU) for the M chart is The follonving 2 samples regarding the time spent with each custonser were tecorfed in May 2022 2. Using the control limits calculated in the previous question, check if the process was still in control in May 202 For the new sample 1. the mean is For the new sampte 2 , the mean is The process is [olease input either in controc or inot in contone


