please be specific and step by step: mainly specific work for Q2, and I think Q1 and Q2 are related
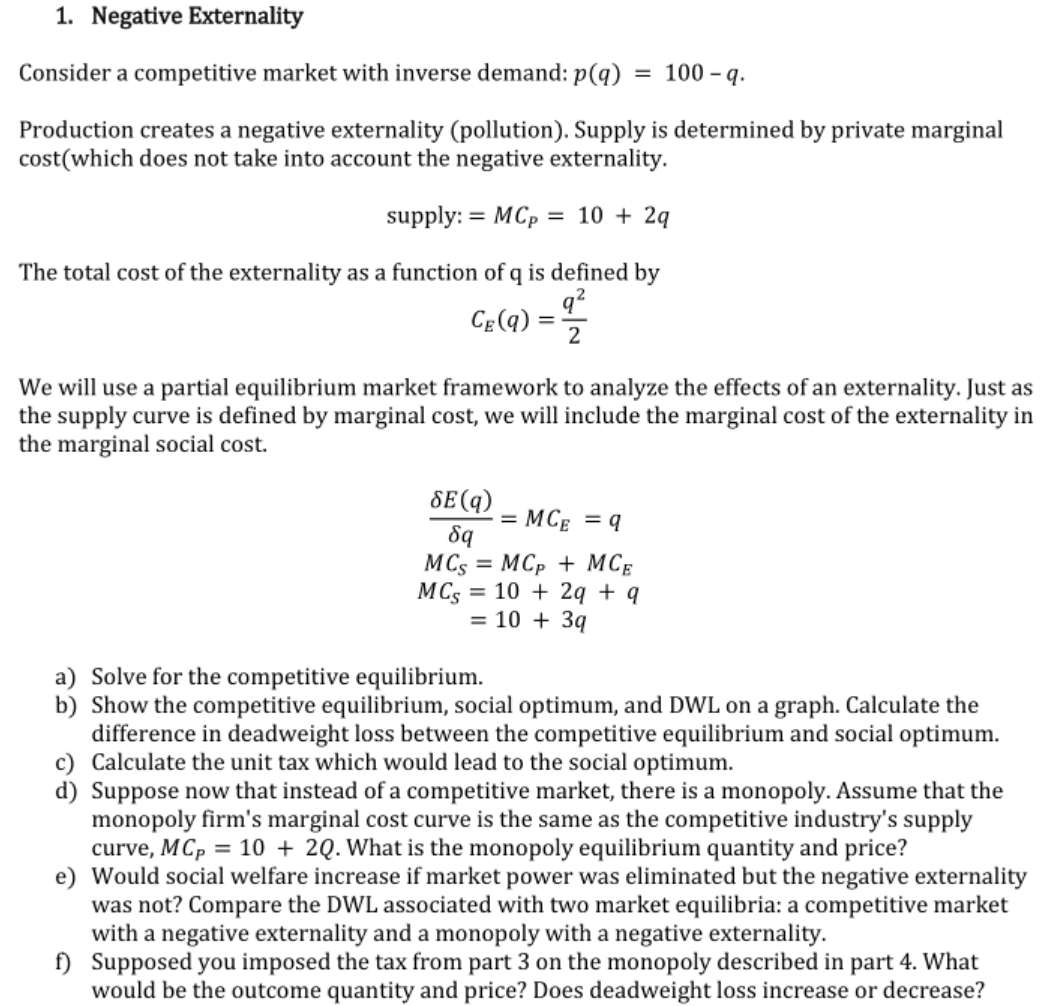
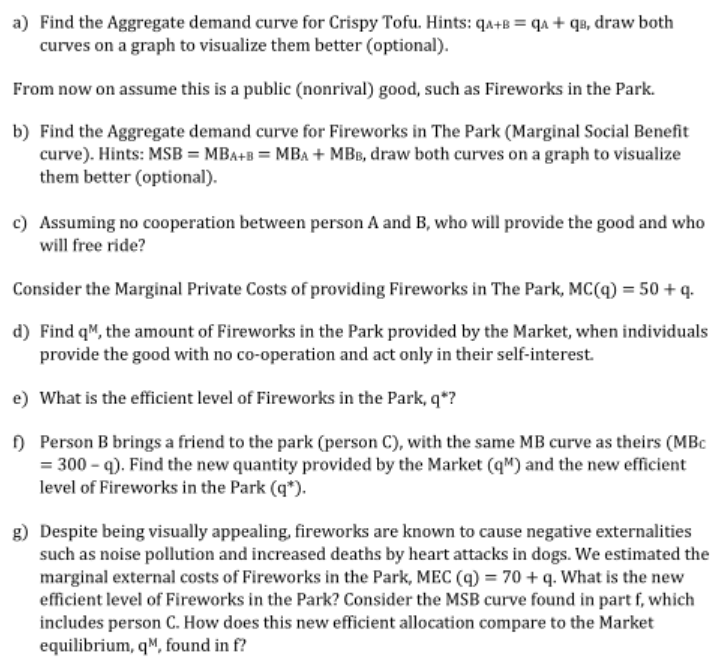
1. Negative Exharnality Consider a competitive market with inverse demand: 190;) = 100 - q. Production creates a negative externality (pollution). Supplyr is determined by private marginal cost(which does not take into account the negative externality. supply:= M6}. = 10 + 2:; The total cost of the externality as a function of q is dened by 2 62(0) = q; We will use a partial equilibrium market framework to analyze the effects ofan externality. just as the supply curve is defined by marginal cost. we will include the marginal cost of the externality in the marginal social cost. MCS=MCP+MCE MCS=10+2q+q =10+3q a) Solve for the competitive equilibrium. b) Show the competitive equilibrium, social optimum, and DWL on a graph. Calculate the difference in deadweight loss between the competitive equilibrium and social optimum. c) Calculate the unit tax which would lead to the social optimum. (1) Suppose now that instead of a competitive market, there is a monopoly. Assume that the monopoly firm's marginal cost curve is the same as the competitive industry's supply curve, M6,; = 10 + 20. What is the monopoly equilibrium quantity and price? e) Would social welfare increase if market power was eliminated but the negative externality was not? Compare the DWI. associated with two market equilibria: a competitive market with a negative externality and a monopoly with a negative externality. f) Supposed you imposed the tax from part 3 on the monopoly described in part 4. What would be the outcome quantity and price? Does deadweight loss increase or decrease? 2. Fireworks in the Park: Aggregating Demand for Public Goods Consider the following marginal benefit (demand) curves of two individuals for a certain good: MBA(q) = 100 - q and MBB(q) = 300 - q. First assume this is a private (rival) good, such as Crispy Tofu.it) Find the Aggregate demand route for Crispy Tofu. Hints: one = on + on. draw both curves on a graph to via utilize them better (optional). From now on assume this Is a public (nonrival) good, such as Fireworks in the Park. In) Find the Aggregate demand curve for Fireworks In The Park (Marginal Social Benet curve). Hints: MSB = MBa+n = MBn + Mlle. draw both curves on a graph to visualize them better (optional). c) Assuming no cooperation between person A and 13. who will provide the good and who will free ride? Consider the Marginal Private Costs of providing Fireworks In The Park. "C(q) = 50 + q. d) Find q\". the amount of Fireworks in the Park provided by the Market. when individuals provide the good with no cooperao'on and act only in their self-interest. e) What Is the efcient level of Fireworks in the Park. :1\"? f} Person B brings a friend to the park (person C}, with the same MB curve as theirs (MBc = 300 - q). Find the new quantity provided by the Market to") and the new efcient level of Fireworks in the Park 01"). 3) Despite being visually appealing. reworks are known to cause negative externalities such as noise pollution and increased deaths by heart attacks in dogs. We estimated the marginal external costs of Fireworks in the Park, MEC (q) = 70 + q. What is the new efcient level of Fireworks in the Park? Consider the M58 curve found In part i. which includes person C. How does this new efficient allocation compare to the Market equilibrium. q". found in


