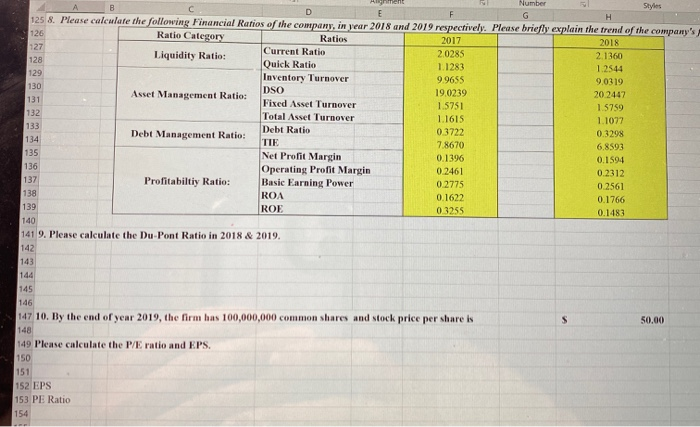
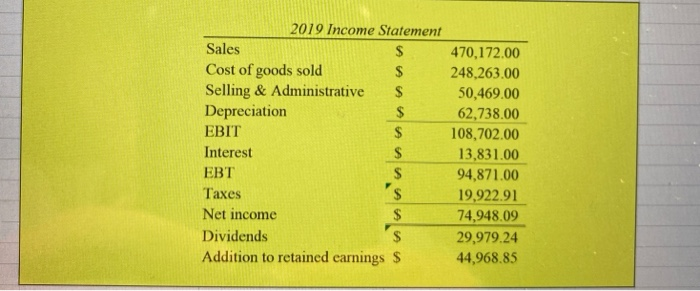
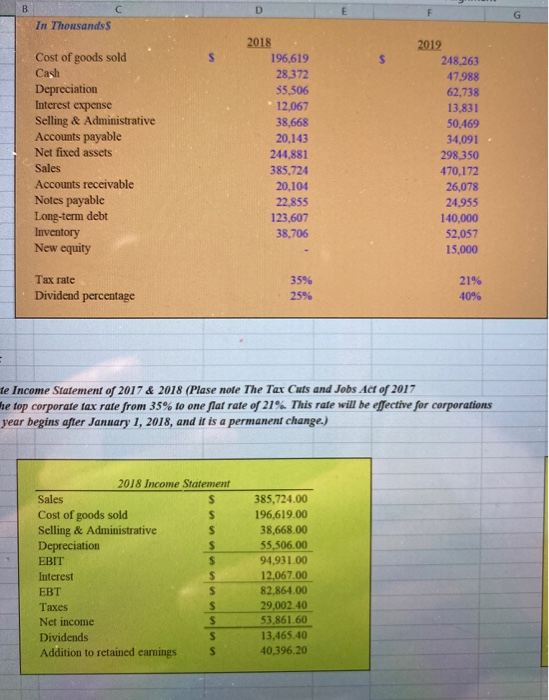
Please calculate
a) Du-point ratio
b) P/E ratio and EPS

Number Styles D E G 125 8. Please calculate the following Financial Ratios of the company, in year 2018 and 2019 respectively. Please briefly explain the trend of the company's 126 Ratio Category Ratios 2017 2018 127 Liquidity Ratio: Current Ratio 2.0285 2.1360 128 Quick Ratio 1.1283 1.2544 129 Inventory Turnover 99655 90319 130 DSO Asset Management Ratio: 19.0239 20 2447 131 Fixed Asset Turnover 1.5751 1.5759 132 Total Asset Turnover 1.1615 1.1077 133 Debt Ratio Debt Management Ratio: 0.3722 0.3298 134 TIE 7.8670 6.8593 135 Net Profit Margin 0.1396 0.1994 136 Operating Profit Margin 0.2461 0.2312 137 Profitabiltiy Ratio: Basic Earning Power 0.2775 0.2561 138 ROA 0.1622 0.1766 139 ROE 03255 0.1483 140 141 9. Please calculate the Du-Pont Ratio in 2018 & 2019. 142 143 144 S 50.00 145 146 147 10. By the end of year 2019, the firm has 100,000,000 common shares and stock price per share is 148 149 Please calculate the PE ratio and EPS. 150 151 152 EPS 153 PE Ratio 154 2019 Income Statement Sales $ 470,172.00 Cost of goods sold $ 248,263.00 Selling & Administrative $ 50,469.00 Depreciation $ 62,738.00 EBIT $ 108,702.00 Interest $ 13,831.00 EBT $ 94,871.00 Taxes 19,922.91 Net income 74,948.09 Dividends $ 29,979.24 Addition to retained earnings $ 44,968.85 B D E F G In Thousands s S Cost of goods sold Cash Depreciation Interest expense Selling & Administrative Accounts payable Net fixed assets Sales Accounts receivable Notes payable Long-term debt Inventory New equity 2018 196,619 28,372 55,506 12,067 38,668 20.143 244,881 385.724 20,104 22.855 123,607 38,706 2019 248,263 47988 62.738 13,831 50,469 34,091 298,350 470,172 26,078 24,955 140,000 52,057 15.000 Tax rate Dividend percentage 35% 2596 21% 40% te Income Statement of 2017 & 2018 (Plase nofe The Tax Cuts and Jobs Act of 2017 he top corporate tax rate from 35% to one flat rate of 21%. This rate will be effective for corporations year begins after January 1, 2018, and it is a permanent change.) 2018 Income Statement Sales $ Cost of goods sold S Selling & Administrative S Depreciation $ EBIT s Interest $ $ Taxes $ Net income S Dividends S Addition to retained earnings S 385,724.00 196,619.00 38,668.00 55,506.00 94,931.00 12.067.00 82.864.00 29.002.40 53,861.60 13,465.40 40,396.20


