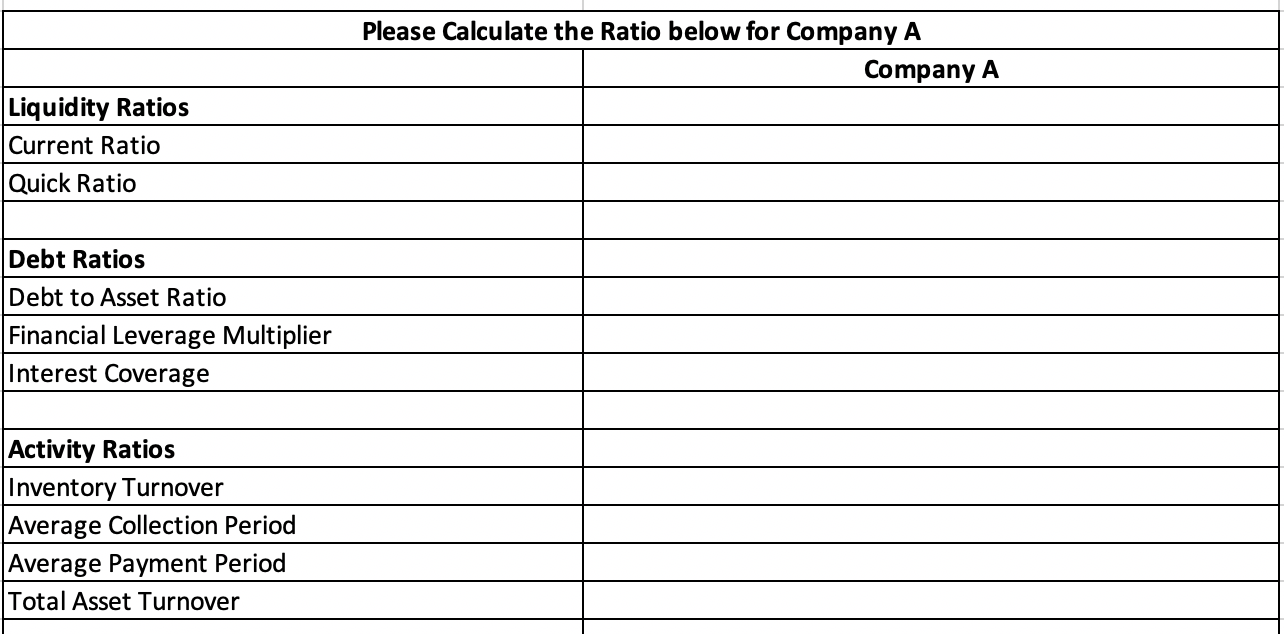
Please calculate all the ratio on the excel for Company A in 2020. Attached the answer. Please shows the progress. (ex. current ratio = total current assets / total current liability = 2020000 / 1418000)
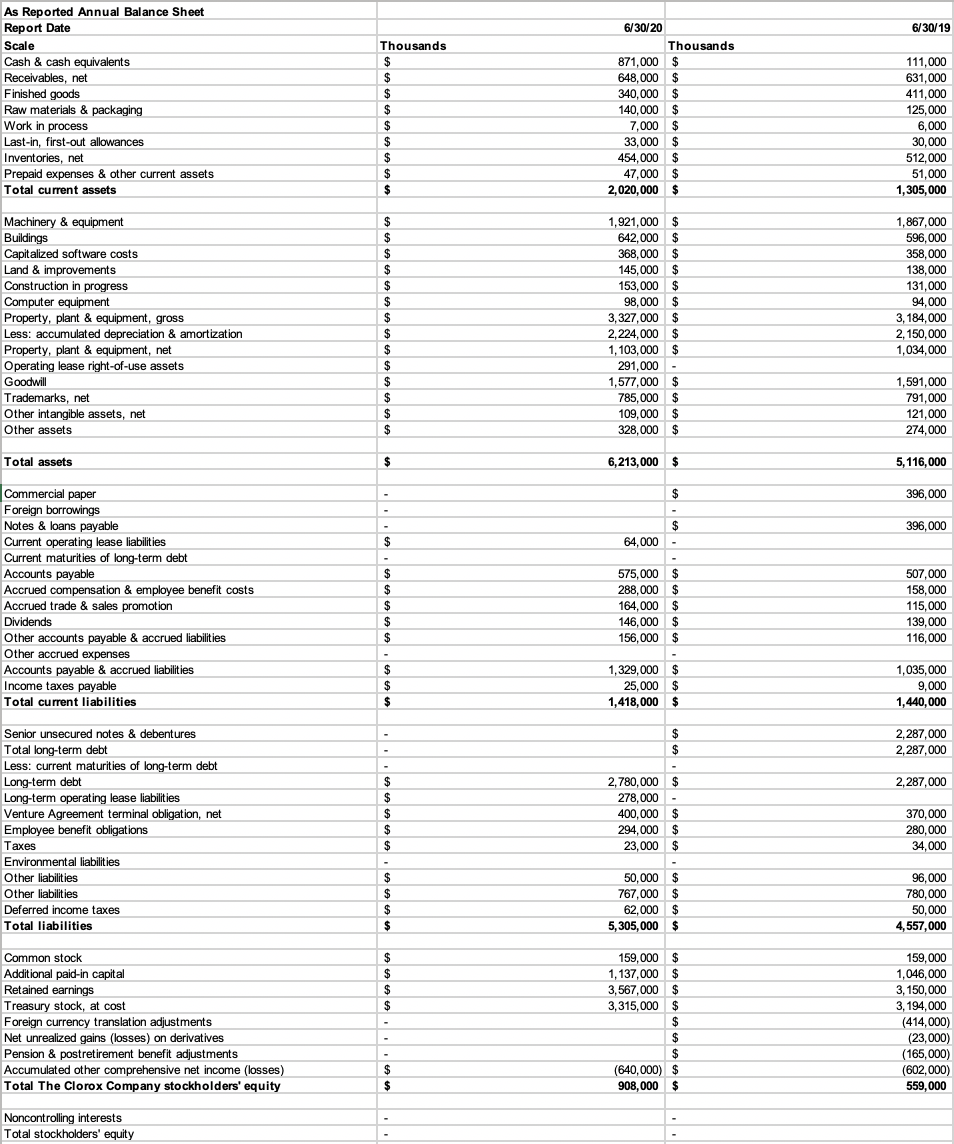
Balance Sheet
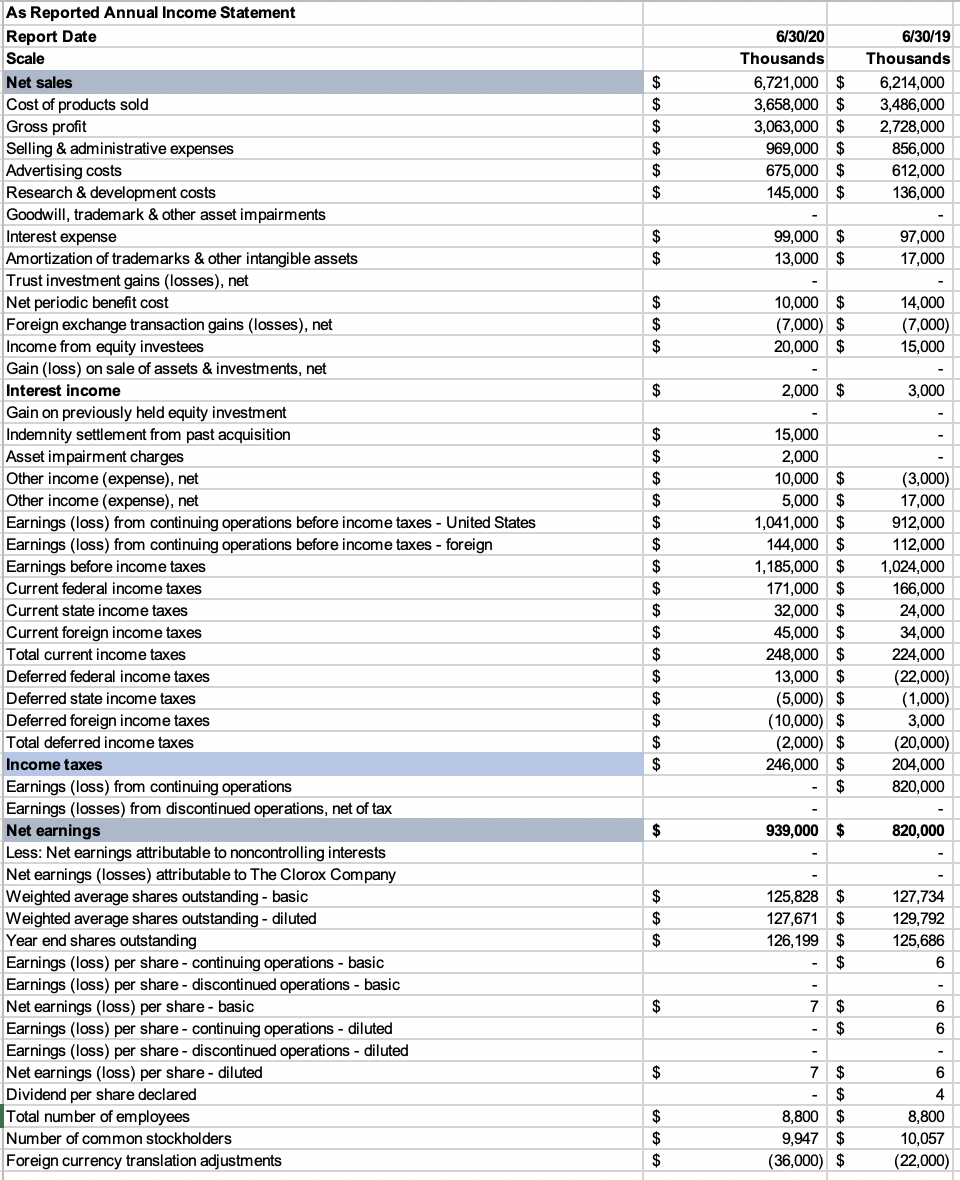
Income Statement
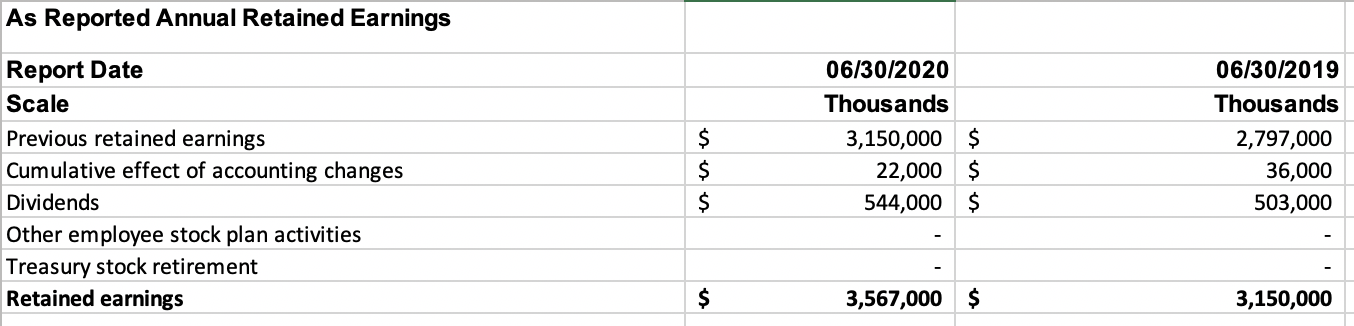
Retained Earning
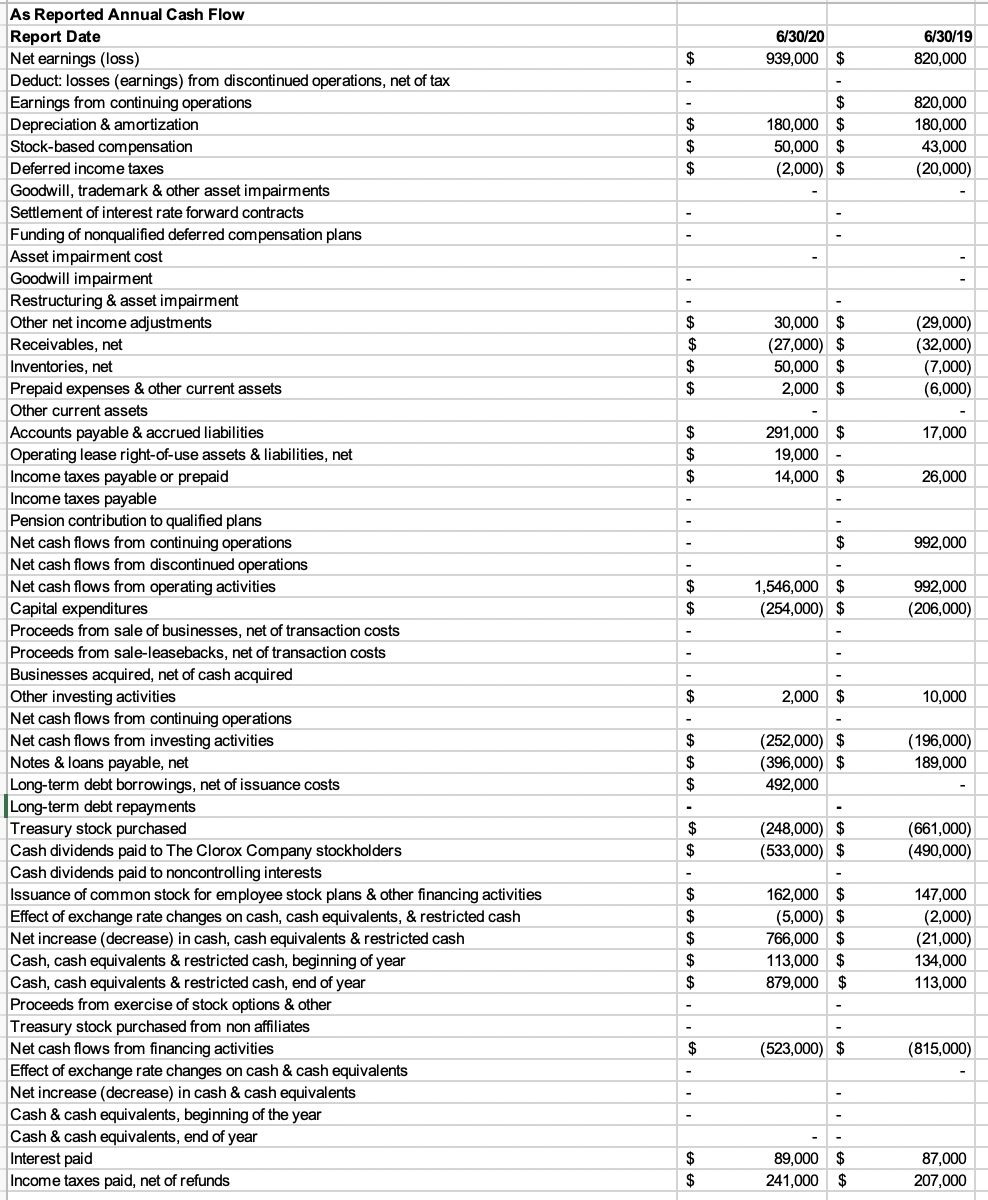
Cash Flow Statement
FYI: Ratio Answer Sheet
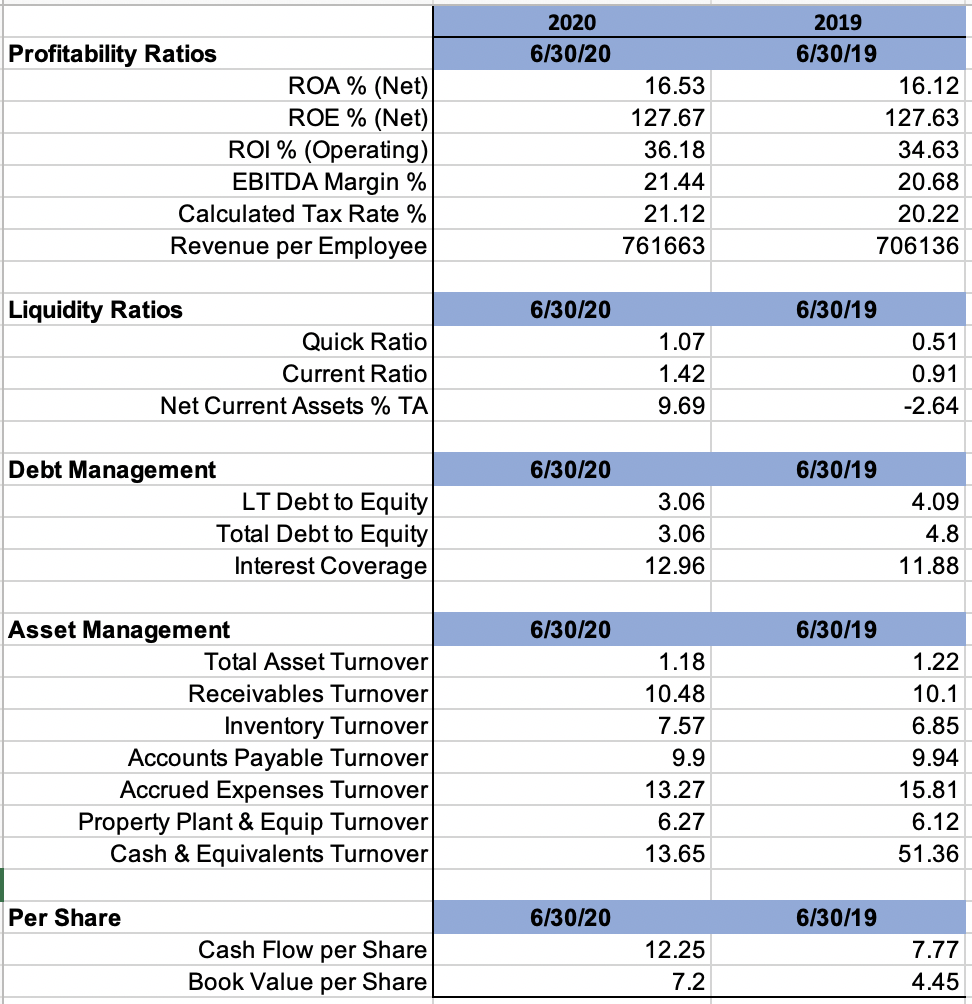
Please Calculate the Ratio below for Company A Company A Liquidity Ratios Current Ratio Quick Ratio Debt Ratios Debt to Asset Ratio Financial Leverage Multiplier Interest Coverage Activity Ratios Inventory Turnover Average Collection Period Average Payment Period Total Asset Turnover 6/30/19 As Reported Annual Balance Sheet Report Date Scale Cash & cash equivalents Receivables, net Recor Finished goods Raw materials & packaging hawan Work in process Last-in, first-out allowances BW Inventories, net , Prepaid expenses & other current assets Total current assets Thousands $ $ $ $ $ $ $ $ $ 6/30/20 Thousands 871,000 $ 648,000 $ 340,000 $ 140,000 $ 7,000 $ 33,000 $ 454.000 $ 47,000 $ 2,020,000 $ 111,000 631,000 411,000 125,000 6,000 30,000 512.000 51,000 1,305,000 Machinery & equipment Buildings Capitalized software costs Land & improvements Construction in progress Computer equipment Property, plant & equipment, gross Less: accumulated depreciation & amortization Property, plant & equipment, net Operating lease right-of-use assets Goodwill Trademarks, net Other intangible assets, net Other assets $ $ $ $ $ $ $ $ $ $ $ $ $ $ 1,921,000 $ 642,000 $ 368,000 $ 145,000 $ 153,000 $ 98,000 $ 3,327,000 $ 2,224,000 $ *** 1,103,000 $ 291,000 . 1,577,000 $ 785,000 $ 109,000 $ 328,000 $ $ 1,867,000 596,000 358,000 138,000 131,000 94,000 3,184,000 2,150,000 1.034.000 1,591,000 791,000 121,000 274,000 Total assets $ 6,213,000 $ 5,116,000 $ 396,000 $ 396,000 $ $ 64,000 507,000 158,000 Commercial paper Foreign borrowings Notes & loans payable Current operating lease liabilities Current maturities of long-term debt Accounts payable endom Accrued compensation & employee benefit costs Accrued trade & sales promotion Dividends Other accounts payable & accrued liabilities Other accrued expenses Accounts payable & accrued liabilities Income taxes payable Total current liabilities $ $ $ $ $ 575,000 $ 288,000 $ 164,000 $ 146,000 $ 156,000 $ 115,000 139,000 116,000 $ $ $ $ 1,329,000 $ 25,000 $ 1,418,000 $ 1,035,000 9,000 1,440,000 $ $ $ 2,287,000 2,287,000 2,780,000 $ 2,287,000 278,000 Senior unsecured notes & debentures Total long-term debt Less: current maturities of long-term debt Long-term debt Long-term operating lease liabilities Venture Agreement terminal obligation, net Employee benefit obligations Taxes Environmental liabilities Other liabilities Other liabilities Deferred income taxes Total liabilities $ $ $ $ $ 400,000 $ 294,000 $ 23,000 $ 370,000 280,000 34,000 $ $ $ $ 50,000 $ 767,000 $ 62,000 $ 5,305,000 $ 96,000 780,000 50,000 4,557,000 $ $ $ $ Common stock Additional paid-in capital Retained earnings Treasury stock, at cost Foreign currency translation adjustments Net unrealized gains (losses) on derivatives Pension & postretirement benefit adjustments Accumulated other comprehensive net income (losses) Total The Clorox Company stockholders' equity 159,000 $ 1, 137,000 $ 3,567,000 $ 3,315,000 $ $ $ $ (640,000) $ 908,000 $ 159,000 1,046,000 3,150,000 3, 194,000 (414,000) (23,000) (165,000) (602,000) 559,000 $ $ Noncontrolling interests Total stockholders' equity ' $ $ $ 6/30/20 Thousands 6,721,000 $ 3,658,000 $ 3,063,000 $ 969,000 $ 675,000 $ 145,000 $ 6/30/19 Thousands 6,214,000 3,486,000 2,728,000 856,000 612,000 136,000 $ $ $ $ $ 99,000 13,000 97,000 17,000 $ $ $ $ $ 10,000 $ (7,000) $ 20,000 $ 14,000 (7,000) 15,000 $ 2,000 $ 3,000 $ $ $ $ $ $ As Reported Annual Income Statement Report Date Scale Net sales Cost of products sold Gross profit Selling & administrative expenses Advertising costs Research & development costs Goodwill, trademark & other asset impairments Interest expense Amortization of trademarks & other intangible assets Trust investment gains (losses), net Net periodic benefit cost Foreign exchange transaction gains (losses), net Income from equity investees Gain (loss) on sale of assets & investments, net Interest income Gain on previously held equity investment Indemnity settlement from past acquisition Asset impairment charges Other income (expense), net Other income (expense), net Earnings (loss) from continuing operations before income taxes - United States Earnings (loss) from continuing operations before income taxes - foreign Earnings before income taxes Current federal income taxes Current state income taxes Current foreign income taxes Total current income taxes Deferred federal income taxes Deferred state income taxes Deferred foreign income taxes Total deferred income taxes Income taxes Earnings (loss) from continuing operations Earnings (losses) from discontinued operations, net of tax Net earnings Less: Net earnings attributable to noncontrolling interests earnings (losses) attributable to The Clorox Company Weighted average shares outstanding - basic Weighted average shares outstanding - diluted Year end shares outstanding Earnings (loss) per share - continuing operations - basic Earnings (loss) per share - discontinued operations - basic Net earnings (loss) per share - basic Earnings (loss) per share - continuing operations - diluted Earnings (loss) per share - discontinued operations - diluted Net earnings (loss) per share-diluted Dividend per share declared Total number of employees Number of common stockholders Foreign currency translation adjustments $ $ $ 15,000 2,000 10,000 $ 5,000 $ 1,041,000 $ 144,000 $ 1,185,000 $ 171,000 $ 32,000 $ 45,000 $ 248,000 $ 13,000 $ (5,000) $ (10,000) $ (2,000) $ 246,000 $ $ $ (3,000) 17,000 912,000 112,000 1,024,000 166,000 24,000 34,000 224,000 (22,000) (1,000) 3,000 (20,000) 204,000 820,000 $ $ $ $ $ $ $ 939,000 $ 820,000 $ $ $ 125,828 $ 127,671 $ 126,199 $ $ 127,734 129,792 125,686 6 $ 7 6 $ $ 6 $ 6 - 4 $ $ $ 7 $ $ 8,800 $ 9,947 $ (36,000) $ 8,800 10,057 (22,000) As Reported Annual Retained Earnings $ Report Date Scale Previous retained earnings Cumulative effect of accounting changes Dividends Other employee stock plan activities Treasury stock retirement Retained earnings 06/30/2020 Thousands 3,150,000 $ 22,000 $ 544,000 $ 06/30/2019 Thousands 2,797,000 36,000 503,000 $ $ 3,567,000 $ 3,150,000 6/30/20 939,000 $ 6/30/19 820,000 $ $ $ 180,000 $ 50,000 $ (2,000) $ 820,000 180,000 43,000 (20,000) $ $ $ $ $ $ 30,000 $ (27,000) $ 50,000 $ 2,000 $ (29,000) (32,000) (7,000) (6,000) 17,000 $ $ $ 291,000 $ 19,000 14,000 $ 26,000 $ 992,000 $ As Reported Annual Cash Flow Report Date Net earnings (loss) Deduct: losses (earnings) from discontinued operations, net of tax Earnings from continuing operations Depreciation & amortization Stock-based compensation Deferred income taxes Goodwill, trademark & other asset impairments Settlement of interest rate forward contracts Funding of nonqualified deferred compensation plans Asset impairment cost Goodwill impairment Restructuring & asset impairment Other net income adjustments Receivables, net Inventories, net Prepaid expenses & other current assets Other current assets Accounts payable & accrued liabilities Operating lease right-of-use assets & liabilities, net Income taxes payable or prepaid Income taxes payable Pension contribution to qualified plans Net cash flows from continuing operations Net cash flows from discontinued operations Net cash flows from operating activities Capital expenditures Proceeds from sale of businesses, net of transaction costs Proceeds from sale-leasebacks, net of transaction costs Businesses acquired, net of cash acquired Other investing activities Net cash flows from continuing operations Net cash flows from investing activities Notes & loans payable, net Long-term debt borrowings, net of issuance costs Long-term debt repayments Treasury stock purchased Cash dividends paid to The Clorox Company stockholders Cash dividends paid to noncontrolling interests Issuance of common stock for employee stock plans & other financing activities Effect of exchange rate changes on cash, cash equivalents, & restricted cash Net increase (decrease) in cash, cash equivalents & restricted cash Cash, cash equivalents & restricted cash, beginning of year Cash, cash equivalents & restricted cash, end of year Proceeds from exercise of stock options & other Treasury stock purchased from non affiliates Net cash flows from financing activities Effect of exchange rate changes on cash & cash equivalents Net increase (decrease) in cash & cash equivalents Cash & cash equivalents, beginning of the year Cash & cash equivalents, end of year Interest paid Income taxes paid, net of refunds 1,546,000 $ (254,000) $ 992,000 (206,000) $ $ 2,000 $ 10,000 $ (252,000) $ (396,000) $ 492,000 (196,000) 189,000 $ $ $ $ (248,000) $ (533,000) $ (661,000) (490,000) $ $ $ $ $ 162,000 $ (5,000) $ 766,000 $ 113,000 $ 879,000 $ 147,000 (2,000) (21,000) 134,000 113,000 $ (523,000) $ (815,000) A s 89,000 $ 241,000 $ 87,000 207,000 $ Profitability Ratios ROA % (Net) ROE % (Net) ROI % (Operating) EBITDA Margin % Calculated Tax Rate % Revenue per Employee 2020 6/30/20 16.53 127.67 36.18 21.44 21.12 761663 2019 6/30/19 16.12 127.63 34.63 20.68 20.22 706136 6/30/20 6/30/19 Liquidity Ratios Quick Ratio Current Ratio Net Current Assets % TA 1.07 1.42 9.69 0.51 0.91 -2.64 6/30/20 6/30/19 Debt Management LT Debt to Equity Total Debt to Equity Interest Coverage 3.06 3.06 12.96 4.09 4.8 11.88 6/30/20 6/30/19 Asset Management Total Asset Turnover Receivables Turnover Inventory Turnover Accounts Payable Turnover Accrued Expenses Turnover Property Plant & Equip Turnover Cash & Equivalents Turnover 1.18 10.48 7.57 9.9 13.27 6.27 13.65 1.22 10.1 6.85 9.94 15.81 6.12 51.36 Per Share 6/30/20 6/30/19 Cash Flow per Share Book Value per Share 12.25 7.2 7.77 4.45 Please Calculate the Ratio below for Company A Company A Liquidity Ratios Current Ratio Quick Ratio Debt Ratios Debt to Asset Ratio Financial Leverage Multiplier Interest Coverage Activity Ratios Inventory Turnover Average Collection Period Average Payment Period Total Asset Turnover 6/30/19 As Reported Annual Balance Sheet Report Date Scale Cash & cash equivalents Receivables, net Recor Finished goods Raw materials & packaging hawan Work in process Last-in, first-out allowances BW Inventories, net , Prepaid expenses & other current assets Total current assets Thousands $ $ $ $ $ $ $ $ $ 6/30/20 Thousands 871,000 $ 648,000 $ 340,000 $ 140,000 $ 7,000 $ 33,000 $ 454.000 $ 47,000 $ 2,020,000 $ 111,000 631,000 411,000 125,000 6,000 30,000 512.000 51,000 1,305,000 Machinery & equipment Buildings Capitalized software costs Land & improvements Construction in progress Computer equipment Property, plant & equipment, gross Less: accumulated depreciation & amortization Property, plant & equipment, net Operating lease right-of-use assets Goodwill Trademarks, net Other intangible assets, net Other assets $ $ $ $ $ $ $ $ $ $ $ $ $ $ 1,921,000 $ 642,000 $ 368,000 $ 145,000 $ 153,000 $ 98,000 $ 3,327,000 $ 2,224,000 $ *** 1,103,000 $ 291,000 . 1,577,000 $ 785,000 $ 109,000 $ 328,000 $ $ 1,867,000 596,000 358,000 138,000 131,000 94,000 3,184,000 2,150,000 1.034.000 1,591,000 791,000 121,000 274,000 Total assets $ 6,213,000 $ 5,116,000 $ 396,000 $ 396,000 $ $ 64,000 507,000 158,000 Commercial paper Foreign borrowings Notes & loans payable Current operating lease liabilities Current maturities of long-term debt Accounts payable endom Accrued compensation & employee benefit costs Accrued trade & sales promotion Dividends Other accounts payable & accrued liabilities Other accrued expenses Accounts payable & accrued liabilities Income taxes payable Total current liabilities $ $ $ $ $ 575,000 $ 288,000 $ 164,000 $ 146,000 $ 156,000 $ 115,000 139,000 116,000 $ $ $ $ 1,329,000 $ 25,000 $ 1,418,000 $ 1,035,000 9,000 1,440,000 $ $ $ 2,287,000 2,287,000 2,780,000 $ 2,287,000 278,000 Senior unsecured notes & debentures Total long-term debt Less: current maturities of long-term debt Long-term debt Long-term operating lease liabilities Venture Agreement terminal obligation, net Employee benefit obligations Taxes Environmental liabilities Other liabilities Other liabilities Deferred income taxes Total liabilities $ $ $ $ $ 400,000 $ 294,000 $ 23,000 $ 370,000 280,000 34,000 $ $ $ $ 50,000 $ 767,000 $ 62,000 $ 5,305,000 $ 96,000 780,000 50,000 4,557,000 $ $ $ $ Common stock Additional paid-in capital Retained earnings Treasury stock, at cost Foreign currency translation adjustments Net unrealized gains (losses) on derivatives Pension & postretirement benefit adjustments Accumulated other comprehensive net income (losses) Total The Clorox Company stockholders' equity 159,000 $ 1, 137,000 $ 3,567,000 $ 3,315,000 $ $ $ $ (640,000) $ 908,000 $ 159,000 1,046,000 3,150,000 3, 194,000 (414,000) (23,000) (165,000) (602,000) 559,000 $ $ Noncontrolling interests Total stockholders' equity ' $ $ $ 6/30/20 Thousands 6,721,000 $ 3,658,000 $ 3,063,000 $ 969,000 $ 675,000 $ 145,000 $ 6/30/19 Thousands 6,214,000 3,486,000 2,728,000 856,000 612,000 136,000 $ $ $ $ $ 99,000 13,000 97,000 17,000 $ $ $ $ $ 10,000 $ (7,000) $ 20,000 $ 14,000 (7,000) 15,000 $ 2,000 $ 3,000 $ $ $ $ $ $ As Reported Annual Income Statement Report Date Scale Net sales Cost of products sold Gross profit Selling & administrative expenses Advertising costs Research & development costs Goodwill, trademark & other asset impairments Interest expense Amortization of trademarks & other intangible assets Trust investment gains (losses), net Net periodic benefit cost Foreign exchange transaction gains (losses), net Income from equity investees Gain (loss) on sale of assets & investments, net Interest income Gain on previously held equity investment Indemnity settlement from past acquisition Asset impairment charges Other income (expense), net Other income (expense), net Earnings (loss) from continuing operations before income taxes - United States Earnings (loss) from continuing operations before income taxes - foreign Earnings before income taxes Current federal income taxes Current state income taxes Current foreign income taxes Total current income taxes Deferred federal income taxes Deferred state income taxes Deferred foreign income taxes Total deferred income taxes Income taxes Earnings (loss) from continuing operations Earnings (losses) from discontinued operations, net of tax Net earnings Less: Net earnings attributable to noncontrolling interests earnings (losses) attributable to The Clorox Company Weighted average shares outstanding - basic Weighted average shares outstanding - diluted Year end shares outstanding Earnings (loss) per share - continuing operations - basic Earnings (loss) per share - discontinued operations - basic Net earnings (loss) per share - basic Earnings (loss) per share - continuing operations - diluted Earnings (loss) per share - discontinued operations - diluted Net earnings (loss) per share-diluted Dividend per share declared Total number of employees Number of common stockholders Foreign currency translation adjustments $ $ $ 15,000 2,000 10,000 $ 5,000 $ 1,041,000 $ 144,000 $ 1,185,000 $ 171,000 $ 32,000 $ 45,000 $ 248,000 $ 13,000 $ (5,000) $ (10,000) $ (2,000) $ 246,000 $ $ $ (3,000) 17,000 912,000 112,000 1,024,000 166,000 24,000 34,000 224,000 (22,000) (1,000) 3,000 (20,000) 204,000 820,000 $ $ $ $ $ $ $ 939,000 $ 820,000 $ $ $ 125,828 $ 127,671 $ 126,199 $ $ 127,734 129,792 125,686 6 $ 7 6 $ $ 6 $ 6 - 4 $ $ $ 7 $ $ 8,800 $ 9,947 $ (36,000) $ 8,800 10,057 (22,000) As Reported Annual Retained Earnings $ Report Date Scale Previous retained earnings Cumulative effect of accounting changes Dividends Other employee stock plan activities Treasury stock retirement Retained earnings 06/30/2020 Thousands 3,150,000 $ 22,000 $ 544,000 $ 06/30/2019 Thousands 2,797,000 36,000 503,000 $ $ 3,567,000 $ 3,150,000 6/30/20 939,000 $ 6/30/19 820,000 $ $ $ 180,000 $ 50,000 $ (2,000) $ 820,000 180,000 43,000 (20,000) $ $ $ $ $ $ 30,000 $ (27,000) $ 50,000 $ 2,000 $ (29,000) (32,000) (7,000) (6,000) 17,000 $ $ $ 291,000 $ 19,000 14,000 $ 26,000 $ 992,000 $ As Reported Annual Cash Flow Report Date Net earnings (loss) Deduct: losses (earnings) from discontinued operations, net of tax Earnings from continuing operations Depreciation & amortization Stock-based compensation Deferred income taxes Goodwill, trademark & other asset impairments Settlement of interest rate forward contracts Funding of nonqualified deferred compensation plans Asset impairment cost Goodwill impairment Restructuring & asset impairment Other net income adjustments Receivables, net Inventories, net Prepaid expenses & other current assets Other current assets Accounts payable & accrued liabilities Operating lease right-of-use assets & liabilities, net Income taxes payable or prepaid Income taxes payable Pension contribution to qualified plans Net cash flows from continuing operations Net cash flows from discontinued operations Net cash flows from operating activities Capital expenditures Proceeds from sale of businesses, net of transaction costs Proceeds from sale-leasebacks, net of transaction costs Businesses acquired, net of cash acquired Other investing activities Net cash flows from continuing operations Net cash flows from investing activities Notes & loans payable, net Long-term debt borrowings, net of issuance costs Long-term debt repayments Treasury stock purchased Cash dividends paid to The Clorox Company stockholders Cash dividends paid to noncontrolling interests Issuance of common stock for employee stock plans & other financing activities Effect of exchange rate changes on cash, cash equivalents, & restricted cash Net increase (decrease) in cash, cash equivalents & restricted cash Cash, cash equivalents & restricted cash, beginning of year Cash, cash equivalents & restricted cash, end of year Proceeds from exercise of stock options & other Treasury stock purchased from non affiliates Net cash flows from financing activities Effect of exchange rate changes on cash & cash equivalents Net increase (decrease) in cash & cash equivalents Cash & cash equivalents, beginning of the year Cash & cash equivalents, end of year Interest paid Income taxes paid, net of refunds 1,546,000 $ (254,000) $ 992,000 (206,000) $ $ 2,000 $ 10,000 $ (252,000) $ (396,000) $ 492,000 (196,000) 189,000 $ $ $ $ (248,000) $ (533,000) $ (661,000) (490,000) $ $ $ $ $ 162,000 $ (5,000) $ 766,000 $ 113,000 $ 879,000 $ 147,000 (2,000) (21,000) 134,000 113,000 $ (523,000) $ (815,000) A s 89,000 $ 241,000 $ 87,000 207,000 $ Profitability Ratios ROA % (Net) ROE % (Net) ROI % (Operating) EBITDA Margin % Calculated Tax Rate % Revenue per Employee 2020 6/30/20 16.53 127.67 36.18 21.44 21.12 761663 2019 6/30/19 16.12 127.63 34.63 20.68 20.22 706136 6/30/20 6/30/19 Liquidity Ratios Quick Ratio Current Ratio Net Current Assets % TA 1.07 1.42 9.69 0.51 0.91 -2.64 6/30/20 6/30/19 Debt Management LT Debt to Equity Total Debt to Equity Interest Coverage 3.06 3.06 12.96 4.09 4.8 11.88 6/30/20 6/30/19 Asset Management Total Asset Turnover Receivables Turnover Inventory Turnover Accounts Payable Turnover Accrued Expenses Turnover Property Plant & Equip Turnover Cash & Equivalents Turnover 1.18 10.48 7.57 9.9 13.27 6.27 13.65 1.22 10.1 6.85 9.94 15.81 6.12 51.36 Per Share 6/30/20 6/30/19 Cash Flow per Share Book Value per Share 12.25 7.2 7.77 4.45