please check if I did these correctly! Thanks
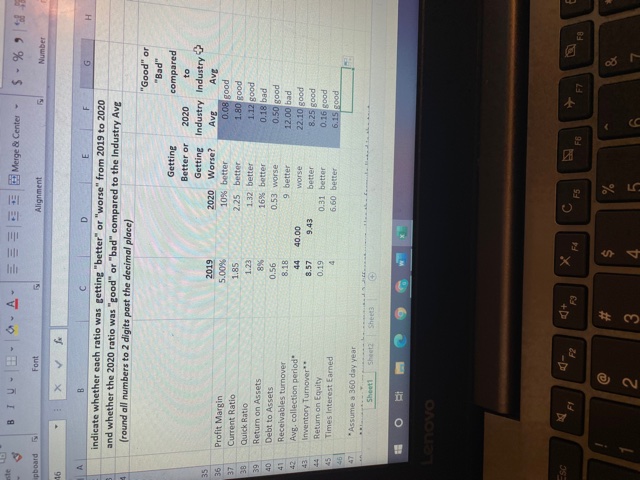
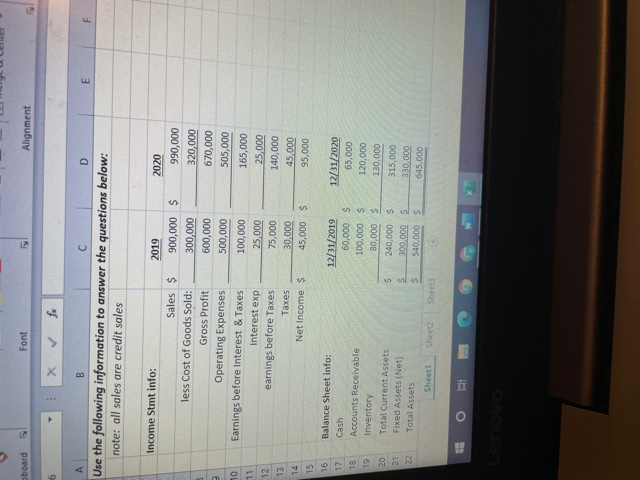
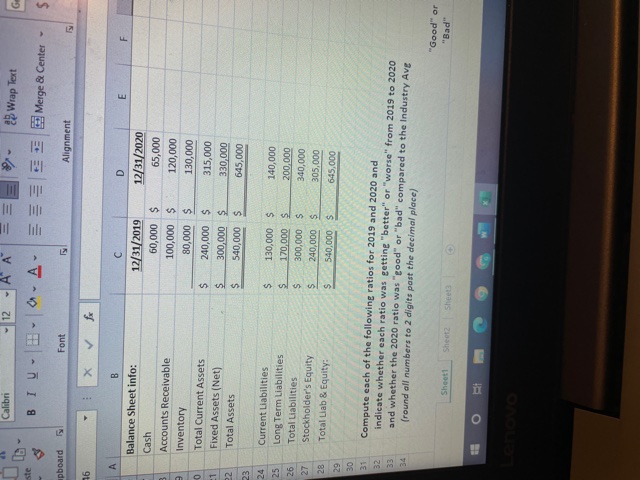
ste BIU A. IM Merge & Center - $ - % ipboard Font Alignment Number 16 H D E F G indicate whether each ratio was getting "better" or "worse" from 2019 to 2020 and whether the 2020 ratio was "good" or "bad" compared to the Industry Avg (round all numbers to 2 digits past the decimal place) "Good" or "Bad" Getting compared Better or 2020 to Getting Industry Industry + 35 2019 2020 Worse? Ave Ave 36 Profit Margin 5.00% 10% better 0.08 good 37 Current Ratio 1.85 2.25 better 1.80 good 38 Quick Ratio 1.23 1.32 better 1.12 good 39 Return on Assets 8% 16% better 0.18 bad 40 Debt to Assets 0.56 0.53 worse 0.50 good 41 Receivables turnover 8.18 9 better 12.00 bad Avg. collection period 44 40.00 worse 22.10 good 43 Inventory Turnover 8.57 9.43 better 8.25 good Return on Equity 0.19 0.31 better 0.16 good 45 Times Interest Eamed 6.60 better 6.15 good *Assume a 360 day year Sheet1 Sheet2 Sheets Lenovo ESC C F4 E F5 FB F7 FO %23 % 2 3 5 CC board Font Alignment 0 fx E B C D Use the following information to answer the questions below: note: all sales are credit sales 2020 Income Stmt info: Sales $ less Cost of Goods Sold: Gross Profit Operating Expenses 10 Earnings before Interest & Taxes Interest exp 12 earnings before Taxes 13 Taxes 14 Net Income $ 15 16 Balance Sheet info: 17 Cash 18 Accounts Receivable 19 Inventory 20 Total Current Assets S 21 Fixed Assets (Net) s 22 Total Assets S Sheet1 Sheet2 Sheets 2019 900,000 $ 300,000 600,000 500,000 100,000 25,000 75,000 30,000 45,000 $ 990,000 320,000 670,000 505,000 165,000 25,000 140,000 45,000 95,000 12/31/2019 60,000 $ 100,000 $ 80,000 $ 240,000 $ 300.000 540,000 $ 12/31/2020 65,000 120,000 130,000 315,000 330.000 645.000 mai Calibri 12 A A 23 Wrap Text ste BIU A Merge & Center $ upboard Font Alignment 16 fx A D E B Balance Sheet info: Cash Accounts Receivable Inventory C 12/31/2019 60,000 $ 100,000 $ 80,000 $ 240,000 $ 300,000 $ 540,000 $ 12/31/2020 65,000 120,000 130,000 315,000 330,000 645,000 0 21 22 Total Current Assets Fixed Assets (Net) Total Assets $ $ $ 23 24 25 26 Current Liabilities Long Term Liabilities Total Liabilities Stockholder's Equity Total Liab & Equity: $ $ $ $ $ 130,000 $ 170,000 $ 300,000 $ 240,000 $ 540,000 $ 27 140,000 200,000 340,000 305,000 645,000 28 29 30 31 32 33 34 Compute each of the following ratios for 2019 and 2020 and indicate whether each ratio was getting better" or "worse" from 2019 to 2020 and whether the 2020 ratio was "good" or "bad" compared to the Industry Ave (round all numbers to 2 digits post the decimal place) "Good" or "Bad" Sheet Sheet2 Sheet