Please complete the vertical analysis for the highlighted items below for Coca Cola Corporation. Please include answers as well as the math that helped you arrive at that solution. I have included the example our professor gave us for Target Corporation, I'm just not sure how the percentages were calculated for the "per share" and "outstanding share" portions
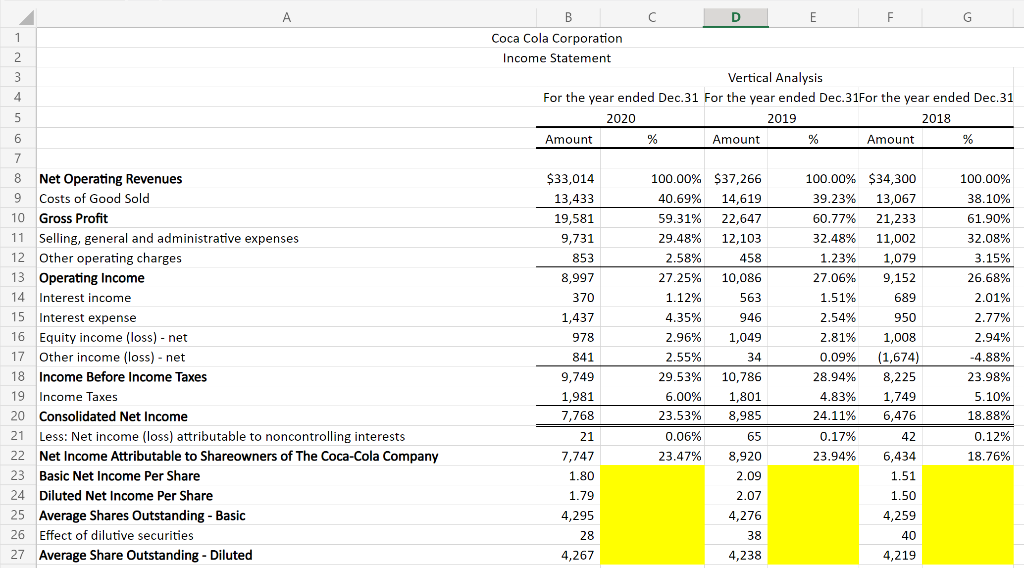
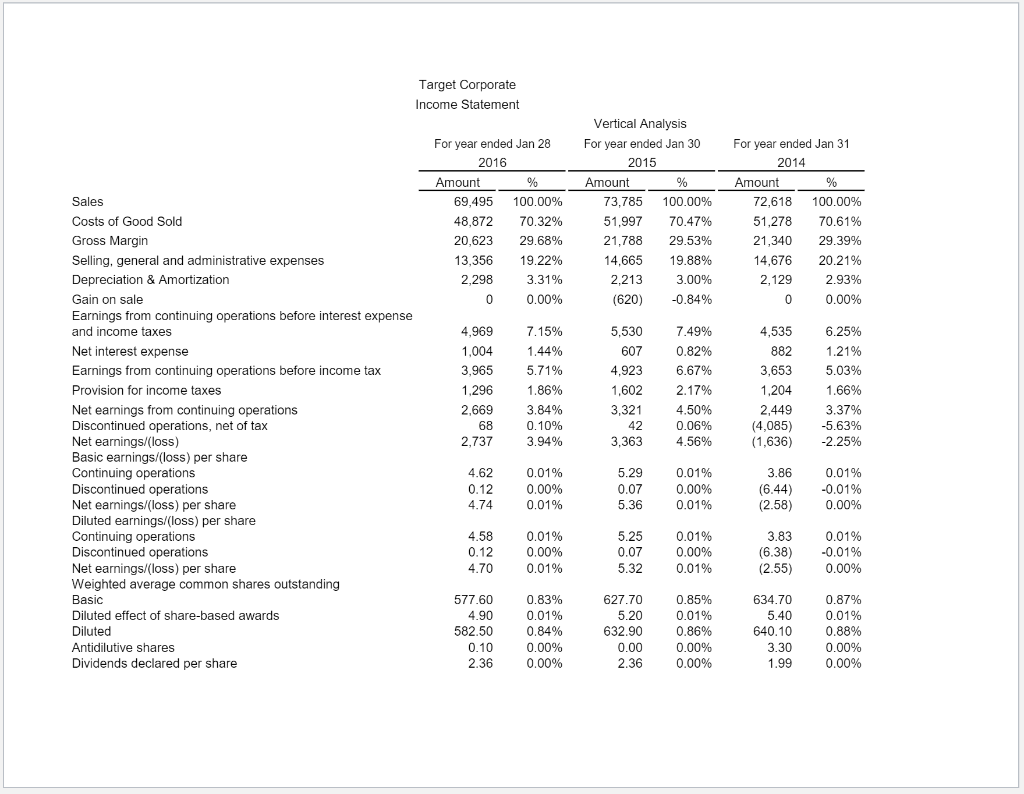
1 2 3 4 B D E F Coca Cola Corporation Income Statement Vertical Analysis For the year ended Dec.31 For the year ended Dec.31For the year ended Dec.31 2020 2019 2018 Amount Amount % Amount % 5 6 $33,014 13,433 19,581 9,731 853 8,997 370 1,437 978 841 9,749 1,981 7,768 100.00% 38.10% 61.90% 32.08% 3.15% 26.68% 2.01% 2.77% 7 8 Net Operating Revenues 9 Costs of Good Sold 10 Gross Profit 11 Selling, general and administrative expenses 12 Other operating charges 13 Operating Income 14 Interest income 15 Interest expense 16 Equity income (loss) - net 17 Other income (loss) - net 18 Income Before Income Taxes 19 Income Taxes 20 Consolidated Net Income 21 Less: Net income (loss) attributable to noncontrolling interests 22 Net Income Attributable to Shareowners of The Coca-Cola Company 23 Basic Net Income Per Share 24 Diluted Net Income Per Share 25 Average Shares Outstanding - Basic 26 Effect of dilutive securities 27 Average Share Outstanding - Diluted 2.94% -4.88% 100.00% $37,266 40.69% 14,619 59.31% 22,647 29.48% 12,103 2.58% 458 27.25% 10,086 1.12% 563 4.35% 946 2.96% 1,049 2.55% 34 29.53% 10,786 6.00% 1,801 23.53% 8,985 0.06% 65 23.47% 8,920 2.09 2.07 4,276 38 4,238 100.00% $34,300 39.23% 13,067 60.77% 21,233 32.48% 11,002 1.23% 1,079 27.06% 9,152 1.51% 689 2.54% 950 2.81% 1,008 0.09% (1,674) 28.94% 8,225 4.83% 1,749 24.11% 6,476 0.17% 42 23.94% 6,434 1.51 1.50 4,259 40 4,219 23.98% 5.10% 18.88% 21 0.12% 18.76% 7,747 1.80 1.79 4,295 28 4,267 Target Corporate Income Statement For year ended Jan 28 2016 Amount % 69,495 100.00% 48,872 70.32% 20,623 29.68% 13,356 19.22% 2.298 3.31% 0 0.00% Vertical Analysis For year ended Jan 30 2015 Amount % 73,785 100.00% 51,997 70.47% 21,788 29.53% 14,665 19.88% 2,213 3.00% (620) -0.84% For year ended Jan 31 2014 Amount % 72,618 100.00% 51.278 70.61% 21,340 29.39% 14,676 20.21% 2,129 2.93% 0 0.00% Sales Costs of Good Sold Gross Margin Selling, general and administrative expenses Depreciation & Amortization Gain on sale Earnings from continuing operations before interest expense and income taxes Net interest expense Earnings from continuing operations before income tax Provision for income taxes Net earnings from continuing operations Discontinued operations, net of tax Net earnings/(loss) Basic earnings/(loss) per share Continuing operations Discontinued operations Net earnings/(loss) per share Diluted earnings/(loss) per share Continuing operations Discontinued operations Net earnings/(loss) per share Weighted average common shares outstanding Basic Diluted effect of share-based awards Diluted - Diluted Antidilutive shares Dividends declared per share 4,969 1,004 3,965 1.296 2,669 68 2,737 7.15% 1.44% 5.71% 1.86% 3.84% 0.10% 3.94% 5,530 607 4,923 1,602 3,321 42 3,363 7.49% 0.82% 6.67% 2.17% 4.50% 0.06% 4.56% 4,535 882 3,653 1,204 2.449 (4,085) (1,636) 6.25% 1.21% 5.03% 1.66% 3.37% -5.63% -2.25% 4.62 0.12 4.74 0.01% 0.00% 0.01% 5.29 0.07 5.36 0.01% 0.00% 0.01% 3.86 (6.44) (2.58) 0.01% -0.01% 0.00% 4.58 0.12 4.70 0.01% 0.00% 0.01% 5.25 0.07 5.32 0.01% 0.00% 0.01% 3.83 (6.38) (2.55) 0.01% -0.01% 0.00% 577.60 4.90 582.50 0.10 2.36 0.83% 0.01% 0.84% 0.00% 0.00% 627.70 5.20 632.90 0.00 2.36 0.85% 0.01% 0.86% 0.00% 0.00% 634.70 5.40 640.10 3.30 1.99 0.87% 0.01% 0.88% 0.00% 0.00% 1 2 3 4 B D E F Coca Cola Corporation Income Statement Vertical Analysis For the year ended Dec.31 For the year ended Dec.31For the year ended Dec.31 2020 2019 2018 Amount Amount % Amount % 5 6 $33,014 13,433 19,581 9,731 853 8,997 370 1,437 978 841 9,749 1,981 7,768 100.00% 38.10% 61.90% 32.08% 3.15% 26.68% 2.01% 2.77% 7 8 Net Operating Revenues 9 Costs of Good Sold 10 Gross Profit 11 Selling, general and administrative expenses 12 Other operating charges 13 Operating Income 14 Interest income 15 Interest expense 16 Equity income (loss) - net 17 Other income (loss) - net 18 Income Before Income Taxes 19 Income Taxes 20 Consolidated Net Income 21 Less: Net income (loss) attributable to noncontrolling interests 22 Net Income Attributable to Shareowners of The Coca-Cola Company 23 Basic Net Income Per Share 24 Diluted Net Income Per Share 25 Average Shares Outstanding - Basic 26 Effect of dilutive securities 27 Average Share Outstanding - Diluted 2.94% -4.88% 100.00% $37,266 40.69% 14,619 59.31% 22,647 29.48% 12,103 2.58% 458 27.25% 10,086 1.12% 563 4.35% 946 2.96% 1,049 2.55% 34 29.53% 10,786 6.00% 1,801 23.53% 8,985 0.06% 65 23.47% 8,920 2.09 2.07 4,276 38 4,238 100.00% $34,300 39.23% 13,067 60.77% 21,233 32.48% 11,002 1.23% 1,079 27.06% 9,152 1.51% 689 2.54% 950 2.81% 1,008 0.09% (1,674) 28.94% 8,225 4.83% 1,749 24.11% 6,476 0.17% 42 23.94% 6,434 1.51 1.50 4,259 40 4,219 23.98% 5.10% 18.88% 21 0.12% 18.76% 7,747 1.80 1.79 4,295 28 4,267 Target Corporate Income Statement For year ended Jan 28 2016 Amount % 69,495 100.00% 48,872 70.32% 20,623 29.68% 13,356 19.22% 2.298 3.31% 0 0.00% Vertical Analysis For year ended Jan 30 2015 Amount % 73,785 100.00% 51,997 70.47% 21,788 29.53% 14,665 19.88% 2,213 3.00% (620) -0.84% For year ended Jan 31 2014 Amount % 72,618 100.00% 51.278 70.61% 21,340 29.39% 14,676 20.21% 2,129 2.93% 0 0.00% Sales Costs of Good Sold Gross Margin Selling, general and administrative expenses Depreciation & Amortization Gain on sale Earnings from continuing operations before interest expense and income taxes Net interest expense Earnings from continuing operations before income tax Provision for income taxes Net earnings from continuing operations Discontinued operations, net of tax Net earnings/(loss) Basic earnings/(loss) per share Continuing operations Discontinued operations Net earnings/(loss) per share Diluted earnings/(loss) per share Continuing operations Discontinued operations Net earnings/(loss) per share Weighted average common shares outstanding Basic Diluted effect of share-based awards Diluted - Diluted Antidilutive shares Dividends declared per share 4,969 1,004 3,965 1.296 2,669 68 2,737 7.15% 1.44% 5.71% 1.86% 3.84% 0.10% 3.94% 5,530 607 4,923 1,602 3,321 42 3,363 7.49% 0.82% 6.67% 2.17% 4.50% 0.06% 4.56% 4,535 882 3,653 1,204 2.449 (4,085) (1,636) 6.25% 1.21% 5.03% 1.66% 3.37% -5.63% -2.25% 4.62 0.12 4.74 0.01% 0.00% 0.01% 5.29 0.07 5.36 0.01% 0.00% 0.01% 3.86 (6.44) (2.58) 0.01% -0.01% 0.00% 4.58 0.12 4.70 0.01% 0.00% 0.01% 5.25 0.07 5.32 0.01% 0.00% 0.01% 3.83 (6.38) (2.55) 0.01% -0.01% 0.00% 577.60 4.90 582.50 0.10 2.36 0.83% 0.01% 0.84% 0.00% 0.00% 627.70 5.20 632.90 0.00 2.36 0.85% 0.01% 0.86% 0.00% 0.00% 634.70 5.40 640.10 3.30 1.99 0.87% 0.01% 0.88% 0.00% 0.00%