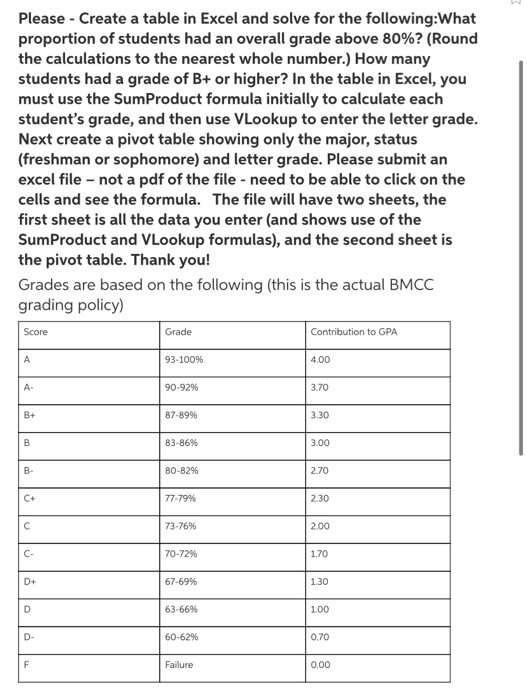
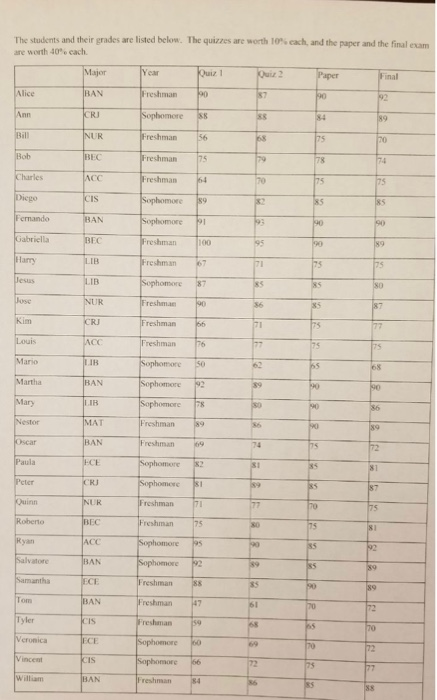
Please - Create a table in Excel and solve for the following:What proportion of students had an overall grade above 80%? (Round the calculations to the nearest whole number.) How many students had a grade of B+ or higher? In the table in Excel, you must use the SumProduct formula initially to calculate each student's grade, and then use VLookup to enter the letter grade. Next create a pivot table showing only the major, status (freshman or sophomore) and letter grade. Please submit an excel file - not a pdf of the file - need to be able to click on the cells and see the formula. The file will have two sheets, the first sheet is all the data you enter (and shows use of the Sum Product and Vlookup formulas), and the second sheet is the pivot table. Thank you! Grades are based on the following (this is the actual BMCC grading policy) Contribution to GPA Score Grade 93-100% 4.00 A. 90-92% 3.70 B+ 87-89% 3.30 B 83-86% 3.00 B- 80-82% 2.70 C+ 77-79% 2.30 C 73-76% 2.00 C 70-72% 1.70 D+ 67-69% 1.30 D 63-66% 1.00 D- 60-62% 0.70 F Failure 0.00 The students and their grades are listed below. The quizzes are worth 10% cach, and the paper and the final exam are worth 40% cach Major Year Kuizi Quiz 2 Paper Alice BAN Freshman 90 Ann KCR Sophomore 88 88 34 89 Bill NUR Freshman 56 75 no Bob Freshman 75 15 79 78 74 Charles ACC Freshman 64 TO 75 75 Diego CIS Sophomore 189 85 85 Fernando BAN Sophomore 90 90 Gabriella BEC Freshman 100 95 89 LIB Freshman 67 71 75 Jesus LIB Sophomore 87 85 SO Jose NUR Freshma 90 87 Kim CRU Freshman CS Louis Freshman ho 77 175 TS Mario LIB Sophomore 50 M 68 Martha BAN Sophomore 92 39 10 Mary Sophomore SO 36 MAT Freshman 89 0 89 Oscar BAN Freshman 74 72 Paula Sophomore 2 31 35 81 Peter CR Sophomore $1 25 87 Quinn NUR Freshman 71 ho 75 Roberto BEC Freshman 75 75 JACC 95 90 35 2 Salvatore Sophomore Sophomore BAN 12 Samantha ECE Freshman 88 33 89 Tom BAN Freshman 47 61 0 72 Tyler CIS Freshman 159 68 70 Veronica ECE 70 Vincent KIS Sophomore 75 27 William BAN Freshman 84 88 Please - Create a table in Excel and solve for the following:What proportion of students had an overall grade above 80%? (Round the calculations to the nearest whole number.) How many students had a grade of B+ or higher? In the table in Excel, you must use the SumProduct formula initially to calculate each student's grade, and then use VLookup to enter the letter grade. Next create a pivot table showing only the major, status (freshman or sophomore) and letter grade. Please submit an excel file - not a pdf of the file - need to be able to click on the cells and see the formula. The file will have two sheets, the first sheet is all the data you enter (and shows use of the Sum Product and Vlookup formulas), and the second sheet is the pivot table. Thank you! Grades are based on the following (this is the actual BMCC grading policy) Contribution to GPA Score Grade 93-100% 4.00 A. 90-92% 3.70 B+ 87-89% 3.30 B 83-86% 3.00 B- 80-82% 2.70 C+ 77-79% 2.30 C 73-76% 2.00 C 70-72% 1.70 D+ 67-69% 1.30 D 63-66% 1.00 D- 60-62% 0.70 F Failure 0.00 The students and their grades are listed below. The quizzes are worth 10% cach, and the paper and the final exam are worth 40% cach Major Year Kuizi Quiz 2 Paper Alice BAN Freshman 90 Ann KCR Sophomore 88 88 34 89 Bill NUR Freshman 56 75 no Bob Freshman 75 15 79 78 74 Charles ACC Freshman 64 TO 75 75 Diego CIS Sophomore 189 85 85 Fernando BAN Sophomore 90 90 Gabriella BEC Freshman 100 95 89 LIB Freshman 67 71 75 Jesus LIB Sophomore 87 85 SO Jose NUR Freshma 90 87 Kim CRU Freshman CS Louis Freshman ho 77 175 TS Mario LIB Sophomore 50 M 68 Martha BAN Sophomore 92 39 10 Mary Sophomore SO 36 MAT Freshman 89 0 89 Oscar BAN Freshman 74 72 Paula Sophomore 2 31 35 81 Peter CR Sophomore $1 25 87 Quinn NUR Freshman 71 ho 75 Roberto BEC Freshman 75 75 JACC 95 90 35 2 Salvatore Sophomore Sophomore BAN 12 Samantha ECE Freshman 88 33 89 Tom BAN Freshman 47 61 0 72 Tyler CIS Freshman 159 68 70 Veronica ECE 70 Vincent KIS Sophomore 75 27 William BAN Freshman 84 88


