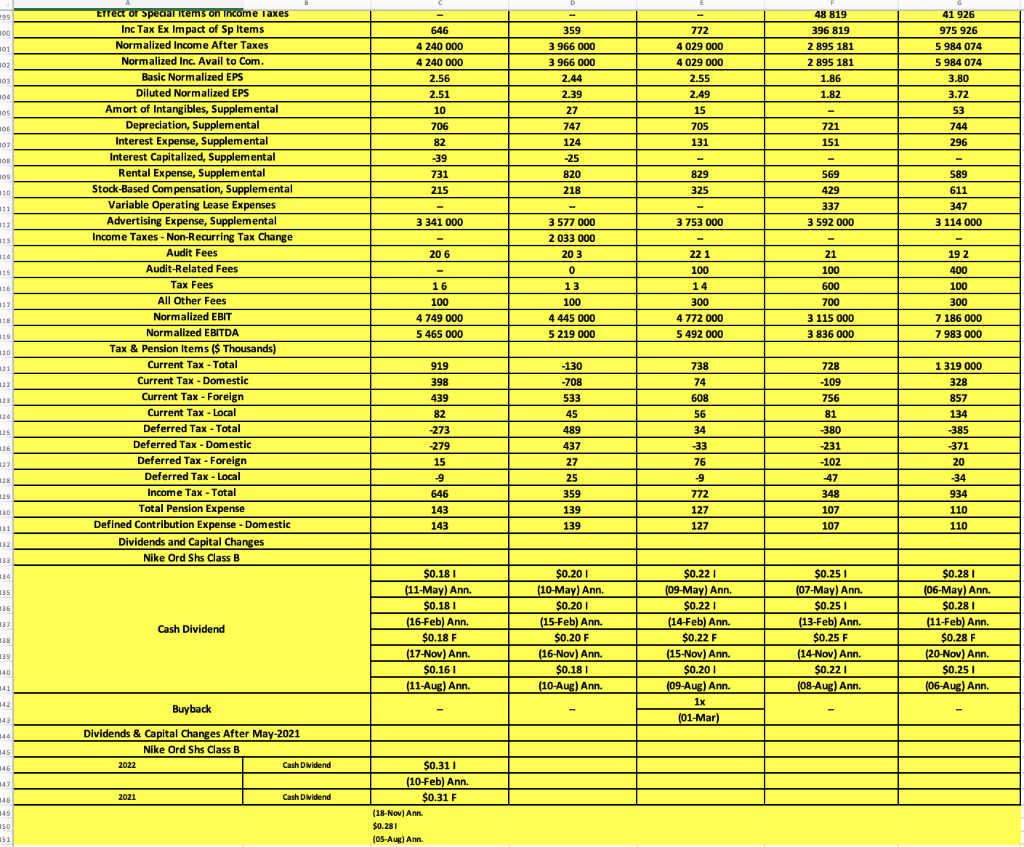
please create and calculate balance sheet and cash flow for year (22,23,24,25,26) using the photo I have upload below
balance sheet
 cash flow
 income statement
A3 Industry - Annual Standardised in Thousands of U.S. Dollan Earnings Quality Score Period End Date Update Type Statement Date Reporting Unit Update Date Reporting Currency Source Source Date Original Announcement Date Complete Statement Flash Update Consolidated Auditor Name Auditor Opinion Accounting Standard Assets ($ Thousands) Cash and Short Term Investments Cash & Equivalents Short Term Investments Accounts Receivable - Trade Net Accounts Receivable - Trade Gross Provision for Doubtful Accounts Total Receivables Net Total Inventory Inventories - Finished Goods Prepaid Expenses Other Current Assets Total Other Current Assets Total Current Assets Property/Plant/Equipment Total - Gross Buildings - Gross Land/Improvements - Gross Machinery/Equipment - Gross Construction in Progress - Gross Other Property/Plant/Equipment - Gross Property/Plant/Equipment Total - Net Accumulated Depreciation Total Goodwill Net Intangibles Net Intangibles - Gross Accumulated Intangible Amortization Other Long Term Assets Total Defered Income Tax - Long Term Asset kalau Tamanka fx Balance Sheet 2017 80 31-May-2017 Updated 31-May-2017 Millions 09-Jan-2022 U.S. Dollar 10-K 20-Jul-2017 29/06/2017 17:00 Complete No Yes PricewaterhouseCoopers LLP Unqualified U.S. GAAP 6 179 000 3 808 000 2 371 000 3 677 000 3 696 000 -19 3 677 000 5 055 000 5 055 000 933 217 217 16 061 000 7 958 000 3 048 000 285 3 867 000 758 3 989 000 -3 969 000 139 283 300 -17 2 787 000 2 763 000 24 2018 90 31-May-2018 Updated 31-May-2018 Millions 09-Jan-2022 U.S. Dollar 10-K 25-Jul-2018 28/06/2018 20:19 Complete No Yes PricewaterhouseCoopers LLP Unqualified U.S. GAAP 5 245 000 4 249 000 996 3 498 000 3 528 000 -30 3 498 000 5 261 000 5 261 000 890 240 240 15 134 000 8 891 000 3 689 000 331 4 230 000 641 4 454 000 -4 437 000 154 285 303 -18 2 509 000 2 349 000 ACO D 2019 94 31-May-2019 Updated 31-May-2019 Millions 10-Jan-2022 U.S. Dollar 10-K 23-Jul-2019 27/06/2019 20:15 Complete No Yes PricewaterhouseCoopers LLP Unqualified with Explanation U.S. GAAP 4 663 000 4 466 000 197 4 272 000 4 302 000 -30 4 272 000 5 622 000 5 622 000 1 352 000 616 616 16 525 000 9 469 000 4 008 000 329 4 335 000 797 4 744 000 -4 725 000 154 283 303 -20 2011 000 2 005 000 C 2020 66 31-May-2020 Updated 31-May-2020 Millions 06-Apr-2022 U.S. Dollar 10-K 24-Jul-2020 25/06/2020 20:15 Complete No Yes PricewaterhouseCoopers LLP Unqualified with Explanation U.S. GAAP 8 787 000 8 348 000 439 2 749 000 2 963 000 -214 2 749 000 7 367 000 7 367 000 1 653 000 20 556 000 12 758 000 3 996 000 345 4 234 000 1 086 000 3 097 000 7 963 000 -4 795 000 223 274 293 -19 2 326 000 2 326 000 F 2021 96 31-May-2021 Updated 31-May-2021 Millions 09-Jan-2022 U.S. Dollar 10-K 20-Jul-2021 24/06/2021 20:18 Complete No Yes PricewaterhouseCoopers LLP Unqualified with Explanation U.S. GAAP 13 476 000 9 889 000 3 587 000 4 463 000 4 556 000 -93 4463 000 6 854 000 6 854 000 1 498 000 26 291 000 13 174 000 4 973 000 363 4 414 000 311 3 113 000 8 017 000 -5 157 000 242 269 296 -27 2 921 000 2 921 000 A3 fx Balance Sheet 217 217 16 061 000 7 958 000 3 048 000 285 3 867 000 758 - 3 989 000 -3 969 000 139 283 300 -17 2 787 000 2 763 000 24 23 259 000 2 048 000 2 375 000 325 6 720 300 84 336 5 474 000 3 471 000 3471 000 3 802 000 1821 000 1 821 000 86 86 10 852 000 0 0 3 x fx A Other Current Assets Total Other Current Assets Total Current Assets Property/Plant/Equipment Total - Gross Buildings - Gross Land/Improvements - Gross Machinery/Equipment - Gross Construction in Progress - Gross Other Property/Plant/Equipment - Gross Property/Plant/Equipment Total - Net Accumulated Depreciation Total Goodwill Net Intangibles Net Intangibles - Gross Accumulated Intangible Amortization Other Long Term Assets Total Defered Income Tax - Long Term Asset Other Long Term Assets Total Assets Liabilities ($ Thousands) Accounts Payable Accrued Expenses Notes Payable/Short Term Debt Current Port. of LT Debt/Capital Leases Other Current liabilities Total Dividends Payable Income Taxes Payable Other Current Liabilities Total Current Liabilities Total Long Term Debt Long Term Debt Total Debt Deferred Income Tax Deferred Income Tax - LT Liability Other Liabilities Total Other Long Term Liabilities Total Liabilities Shareholders Equity ($ Thousands) Redeemable Preferred Stock Total Redeemable Preferred Stock Common Stock Total A 240 240 15 134 000 8 891 000 3 689 000 331 4 230 000 641 - 4 454 000 -4 437 000 154 285 303 -18 2 509 000 2 349 000 160 22 536 000 2 279 000 2 558 000 336 6 861 320 150 391 6 040 000 3 468 000 3 468 000 3 810 000 3 210 000 3 210 000 6 6 12 724 000 0 0 3 616 616 16 525 000 9 469 000 4 008 000 329 4 335 000 797 4 744 000 -4 725 000 154 283 303 -20 2011 000 2 005 000 6 23 717 000 2 612 000 4 271 000 9 6 968 346 229 393 7 866 000 3 464 000 3 464 000 3 479 000 3 345 000 3 345 000 2 2 14 677 000 0 0 3 - 20 556 000 12 758 000 3 996 000 345 4 234 000 1 086 000 3 097 000 7 963 000 -4 795 000 223 274 293 -19 2 326 000 2 326 000 31 342 000 2 248 000 4 504 000 248 3 1 281 000 384 156 741 8 284 000 9 406 000 9 406 000 9 657 000 2 684 000 2 684 000 2 913 000 2 913 000 23 287 000 0 0 3 ~ 26 291 000 13 174 000 4 973 000 363 4 414 000 311 3 113 000 8 017 000 -5 157 000 242 269 296 -27 2 921 000 2 921 000 37 740 000 2 836 000 6 172 000 2 0 664 306 358 9 674 000 9413 000 9 413 000 9 415 000 2 955 000 2 955 000 2 931 000 2 931 000 24 973 000 0 0 3 A A3 X fx Balance Sheet 80 10 852 000 0 Other Long Term Drabilities Total Liabilities Shareholders Equity ($ Thousands) Redeemable Preferred Stock Total Redeemable Preferred Stock Common Stock Total Common Stock Additional Paid-In Capital Retained Earnings (Accumulated Deficit) Other Equity Total Translation Adjustment Other Comprehensive Income Total Equity Total Liabilities & Shareholders' Equity Supplemental ($ Thousands) Shares Outstanding - Common Issue 2 Total Common Shares Outstanding Shares Outs - Common Stock Primary Issue Treas Shares - Common Stock Prmry Issue Treasury Shares - Common Issue 2 Total Equity & Minority Interest Full-Time Employees Number of Common Shareholders Goodwill - Net Accumulated Intangible Amort Suppl. Wgt Avg Rem Lease Term (Yrs)-Oper Lease Wgt Avg Disc Rate - Operating Lease Right-of-Use Assets-Op.Lease Gross-Sup. Curr Port of LT Operating Leases Suppl. Long-Term Operating Lease Liabs. Suppl. Curr Derivative Liab. Hedging Suppl. Non-Curr Derivative Liab. Hedging Suppl Total Current Assets less Inventory Net Debt Incl. Pref.Stock & Min.Interest Tangible Book Value Common Equity Debt & Lease Pension Items ($ Thousands) Total Long Term Debt Supplemental Long Term Debt Maturing within 1 Year Long Term Debt Maturing in Year 2 Long Term Debt Maturing in Year 3 Long Term Debt Maturing in Year 4 Long Term Debt Maturing in Year 5 Long Term Debt Maturing in 2-3 Years 0 3 3 8 638 000 3 979 000 -213 -191 -22 12 407 000 23 259 000 329 1643 000 1 314 000 0 0 12 407 000 744 22 713 139 17 -- -- 336 86 11 006 000 -2 377 000 11 985 000 5 888 000 115 115 115 112 109 230 D 12 724 000 0 0 3 3 6 384 000 3 517 000 -92 -173 81 9 812 000 22 536 000 329 1 601 000 1 272 000 0 0 9 812 000 73 1 22 286 154 18 - 391 6 9 873 000 -1 435 000 9 373 000 5 773 000 115 115 112 109 609 227 D 2 14 677 000 0 0 3 3 7 163 000 1 643 000 231 -346 577 9 040 000 23 717 000 315 1568 000 1 253 000 0 0 9 040 000 76 7 23 318 154 20 -- -- -- 393 2 10 903 000 -1 184 000 8 603 000 5 660 000 115 112 109 609 98 221 2913 VUU 23 287 000 0 0 3 3 8 299 000 -191 -56 -494 438 8 055 000 31 342 000 315 1558 000 1 243 000 0 0 8 055 000 75 4 23 114 223 19 87 24 3 097 000 445 2 913 000 595 13 189 000 870 7 558 000 14 452 000 289 286 786 275 1 275 000 1 072 000 2931 000 24 973 000 0 0 3 3 9 965 000 3 179 000 -380 2 -382 12 767 000 37 740 000 305 1 578 000 1 273 000 0 0 12 767 000 73 3 22 745 242 27 83 23 3 113 000 467 2 931 000 358 19 437 000 -4 061 000 12 256 000 14 163 000 286 786 275 1 275 000 251 1.061.000 43 fx Balance Sheet B 12 407 000 744 22 713 139 17 . - 336 86 11 006 000 -2 377 000 11 985 000 5 888 000 115 115 115 112 109 230 221 5322 000 370 34 32 28 25 26 60 51 225 3 905 000 537 509 438 399 350 947 749 1 672 000 Total Equity & Minority Interest Full-Time Employees Number of Common Shareholders Goodwill - Net Accumulated Intangible Amort Suppl. Wgt Avg Rem Lease Term (Yrs)-Oper Lease Wgt Avg Disc Rate - Operating Lease Right-of-Use Assets-Op.Lease Gross-Sup. Curr Port of LT Operating Leases Suppl. Long-Term Operating Lease Liabs. Suppl. Curr Derivative Liab. Hedging Suppl. Non-Curr Derivative Liab. Hedging Suppl Total Current Assets less Inventory Net Debt Incl. Pref.Stock & Min.Interest Tangible Book Value Common Equity Debt & Lease Pension Items ($ Thousands) Total Long Term Debt Supplemental Long Term Debt Maturing within 1 Year Long Term Debt Maturing in Year 2 Long Term Debt Maturing in Year 3 Long Term Debt Maturing in Year 4 Long Term Debt Maturing in Year 5 Long Term Debt Maturing in 2-3 Years Long Term Debt Maturing in 4-5 Years Long Term Debt Matur. in Year 6 & Beyond Total Capital Leases Supplemental Capital Lease Payments Due in Year 1 Capital Lease Payments Due in Year 2 Capital Lease Payments Due in Year 3 Capital Lease Payments Due in Year 4 Capital Lease Payments Due in Year 5 Capital Lease Payments Due in 2-3 Years Capital Lease Payments Due in 4-5 Years Cap. Lease Pymts. Due in Year 6 & Beyond Total Operating Leases Supplemental Operating Lease Payments Due in Year 1 Operating Lease Payments Due in Year 2 Operating Lease Payments Due in Year 3 Operating Lease Payments Due in Year 4 Operating Lease Payments Due in Year 5 Operating Lease Pymts. Due in 2-3 Years Operating Lease Pymts. Due in 4-5 Years Oper. Lse. Pymts. Due in Year 6 & Beyond Operating Leases - Interest Cost 9 812 000 731 22 286 154 18 - - 391 6 9 873 000 -1 435 000 9 373 000 5 773 000 115 115 112 109 609 227 718 4 713 000 424 44 37 40 38 36 77 74 229 3 965 000 589 523 472 412 361 995 773 1 608 000 9 040 000 76 7 23 318 154 20 -- 393 2 10 903 000 -1 184 000 8 603 000 5 660 000 115 112 109 609 98 221 707 4 617 000 374 32 34 40 37 34 74 71 197 3 732 000 553 513 441 386 345 954 731 1 494 000 8 055 000 75 4 23 114 223 19 87 24 3 097 000 445 2 913 000 595 13 189 000 870 7 558 000 14 452 000 289 286 786 275 1 275 000 1 072 000 1 550 000 11 541 000 3 358 000 550 514 456 416 374 970 790 1 048 000 -426 12 767 000 73 3 22 745 242 27 83 23 3 113 000 467 2 931 000 358 19 437 000 -4 061 000 12 256 000 14 163 000 286 786 275 1 275 000 251 1 061 000 1 526 000 11 290 000 3 398 000 534 530 490 437 357 1 020 000 794 1 050 000 -347 Cash Flow 49 50 Industry-Annual Standardised in Thousands of U.S. Dollars 151 52 Earnings Quality Score Period End Date 153 Period Length 54 55 Update Type Statement Date 56 57 Reporting Unit Reporting Unit 58 Update Date Update Date 50 59 Reporting Currency 160 60 Source Source ... Source Date 161 Codice Date Original Announcement Date Announceme ... 63 63 Complete Statement ... 64 Flash Update Consolidated 165 65 66 66 Auditor Name 67 Auditor Opinion Accounting Standard ash Flow-Operating Activities ($ Thousands) 69 Net Income/Starting Line 70 Depreciation/Depletion 171 Depreciation 172 Amortization 73 174 Amortization of Intangibles Deferred Taxes 175 Non-Cash Items 76 Unusual Items 177 Other Non-Cash Items 178 Changes in Working Capital -79 75 Accounts Receivable 180 Inventories 181 Prepaid Expenses Payable/Accrued Cash from Operating Activities 185 86 ash Flow-Investing Activities ($ Thousands) 187 Capital Expenditures Purchase of Fixed Assets 88 Other Investing Cash Flow Items Total 189 Sale of Fixed Assets 190 Sale/Maturity of Investment 191 Purchase of Investments 192 Other Investing Cash Flow 193 Cash from Investing Activities 195 ash Flow-Financing Activities ($ Thousands) 196 APL 182 183 184 194 2017 2018 31-May-2019 31-May-2017 12 Months Updated 31-May-2017 31-May-2017 12 Months Reclassified 31-May-2018 Millions 09-Jan-2022 -Jan-202 U.S. Dollar 31-May-2018 12 Months Updated 31-May-2018 66 31-May-2020 12 Months Updated 31-May-2020 1-May- 2021 96 31-May-2021 12 Months Updated 31-May-2021 Millions Minions 31-May-2019 Millions 10-Jan-2022 U.S. Dollar Millions Minions 09-Jan-2022 Millions Livimmons 09-Jan-2022 U.S. Dollar 10-K 09-Jan-2022 Millions wimmons 06-Apr-2022 U.S. Dollar U.S. Dollar U.S. Dollar 10-K 10-K BUN 20-Jul-2017 25-Jul-2018 25-Jul-2018 28/06/2018 20:19 Complete 23-Jul-2019 27/06/2019 20:15 29/06/2017 17:00 20-Jul-2021 www 24/06/2021 20:18 24-Jul-2020 25/06/2020 20:15 Complete 28/06/2018 20:19 Complete Complete Complete No No Yes Yes Yes Yes ricewaterhouseCoopers LLP PricewaterhouseCoopers LLP PricewaterhouseCoopers LLP PricewaterhouseCoopers LLP PricewaterhouseCoopers LLP PricewaterhouseCoopers LLP Unqualified Unqualified Unqualified with Explanation Unqualified with Explanation Inqualified with Explanation U.S. GAAP U.S. GAAP U.S. GAAP Unqualified U.S. GAAP U.S. GAAP 4 240 000 4 240 000 2 539 000 5 727 000 706 744 706 721 744 10 53 10 -273 -385 473 98 -117 -138 215 429 611 -1 141 000 -1 245 000 -426 1 239 000 -1 606 000 507 -231 -1 854 000 -120 -364 24 -182 1326 000 6 657 000 3 640 000 2 485 000 -1 105 000 -1 086 000 -695 -695 -1 105 000 -1 086 000 58 97 -3 105 000 13 6 046 000 2 453 000 -5 928 000 -2 426 000 31 6 685 000 -9 961 000 171 -34 -1 008 000 -1 028 000 -3 800 000 ID-L 3 846 000 H -1 105 000 -1 105 000 6 046 000 -5 928 000 -1 008 000 P *-*********|| ||--||-- 1933 000 747 747 647 119 -99 218 1 482 000 187 -255 1515 000 4 955 000 -1 028 000 -1 028 000 1304 000 3 6 109 000 -4 783 000 -25 276 MLA LOL II OUL Non-Cash Items Unusual Items Other Non-Cash Items Changes in Working Capital Accounts Receivable Inventories Prepaid Expenses Payable/Accrued Cash from Operating Activities ash Flow-Investing Activities ($ Thousands) Capital Expenditures Purchase of Fixed Assets Other Investing Cash Flow Items Total Sale of Fixed Assets Sale/Maturity of Investment Purchase of Investments Other Investing Cash Flow Cash from Investing Activities ash Flow-Financing Activities ($ Thousands) Financing Cash Flow Items Other Financing Cash Flow Total Cash Dividends Paid Issuance (Retirement) of Stock Net Repurchase/Retirement of Common Common Stock Net Options Exercised Issuance (Retirement) of Debt Net Short Term Debt Net Long Term Debt Issued Long Term Debt Reduction Long Term Debt Net Cash from Financing Activities Foreign Exchange Effects Net Change in Cash Net Cash - Beginning Balance Net Cash - Ending Balance Cash Interest Paid Cash Taxes Paid Net Changes in Working Capital Free Cash Flow 98 -117 215 -1 141 000 -426 -231 -120 -364 3 640 000 -1 105 000 -1 105 000 97 13 6 046 000 -5 928 000 -34 -1 008 000 177 177 -1 133 000 -2 734 000 -3 223 000 -3 223 000 489 1 748 000 327 1482 000 -61 1421 000 -1 942 000 -20 670 3 138 000 3 808 000 98 703 -1 141 000 2.535 000 ***** BUMB -117 -935 -426 -231 -120 -158 3 846 000 -1 105 000 -1 105 000 6 046 000 -5 928 000 -1 008 000 -1 133 000 -2 734 000 -3 223 000 -3 223 000 1748000 1482000 1421 000 -2 148 000 3 138 000 3 808 000 -935 2 741 000 119 -99 218 1482 000 187 -255 35 1515 000 4 955 000 -1 028 000 -1 028 000 1304 000 3 6 109 000 -4 783 000 -25 276 -55 -55 -1 243 000 -3 521 000 -4 254 000 -4 254 000 733 -16 13 0 -29 -29 -4 835 000 45 441 3 808 000 4 249 000 125 529 1482 000 3 927 000 ****** W-H - HHHHHHH -270 -490 -203 1525 000 5 903 000 -1 119 000 -1 119 000 3 787 000 -2 937 000 -264 -1 332 000 -3 586 000 -4 286 000 -4 286 000 -358 -325 -5 293 000 4 249 000 4 466 000 757 562 4784 000 850 -1 245 000 1 239 000 -1 854 000 -654 2 485 000 -1 086 000 -1 086 000 2 453 000 -2 426 000 -1 028 000 -1 452 000 -2 182 000 -3 067 000 -3 067 000 885 6 183 000 6 134 000 6 134 000 2 491 000 3 882 000 4 466 000 8 348 000 140 1028 000 -1 245 000 1399 000 473 -138 611 45 -1 606 000 507 -182 1 326 000 6 657 000 -695 -695 -3 105 000 6 685 000 -9 961 000 171 -3 800 000 -136 -136 -1 638 000 564 -608 -608 1 172 000 -249 -52 0 -197 -197 -1 459 000 143 1 541 000 8 348 000 9 889 000 293 1 177 000 45 5.962 000 Income Statement Industry-Annual Standardised in Thousands of U.S. Dolars Earnings Quality Score Period End Date Period Length Update Type Statement Date Reporting Unit aporam Opdate Update Date Reporting Currency orting con Source Source Date www.co Original Announcement Date Complete Statement implete Flash Update wat opdate Consolidated wide.co Auditor Name Auditor Opinion muun.com Accounting Standard unting Revenue NCYCINE Net Sales Total Revenue Cost of Revenue, Total Cost of Revenue Gross Profit Selling/General/Admin. Expenses, Total Selling/General/Administrative Expense Labor & Related Expense Advertising Expense Unusual Expense (Income) Restructuring Charge www. Impairment-Assets Held for Use mamans Papers Other Unusual Expense (Income) Japan Pa Total Operating Expense Operating Income Interest Expense, Net Non-Operating than.com p Interest Expense - Non-Operating w Interest Capitalized - Non-Operating Interest/Invest Income - Non-Operating Interest Income - Non-Operating Investment Income - Non-Operating Interest Inc.(Exp.), Net-Non-Op., Total Other, Net Other Non-Operating Income (Expense) Net Income Before Taxes Provision for Income Taxes Net Income After Taxes Net Income Before Extra. Items Extraordinary Item Total Extraordinary Items 2017 80 31-May-2017 12 Months Updated 31-May-2017 Millions winnons 09-Jan-2022 9-9an-2022 U.S. Dollar 10-K 20% 20-Jul-2017 29/06/2017 17:00 Complete No - Yes Tes PricewaterhouseCoopers LLP Unqualified U.S. GAAP Barackm 34 350 000 34 350 000 34 350 000 19 038 000 19 038 000 15 312 000 10 563 000 7 007 000 215 3 341 000 29 601 000 4 749 000 -82 -121 39 - 176 27 - 149 94 43 43 4 886 000 646 4 240 000 4 240 000 2 2018 90 31-May-2018 12 Months Updated 31-May-2018 Millions 09-Jan-2022 U.S. Dollar 10-K 25-Jul-2018 28/06/2018 20:19 Complete No - Yes PricewaterhouseCoopers LLP Unqualified U.S. GAAP 36 397 000 36 397 000 36 397 000 20 441 000 20 441 000 15 956 000 11 511 000 7 716 000 218 3 577 000 31 952 000 4 445 000 -124 -149 25 9 = 70 -61 - -115 -5 = -5 4 325 000 359 3 966 000 3 966 000 -2 033 000 -2 033 000 2019 94 31-May-2019 12 Months Updated 31-May-2019 Millions 10-Jan-2022 U.S. Dollar 10-K 23-Jul-2019 27/06/2019 20:15 Complete No Yes PricewaterhouseCoopers LLP Unqualified with Explanation U.S. GAAP www.anni 39 117 000 39 117 000 39 117 000 21 643 000 21 643 000 17 474 000 12 702 000 8 949 000 3 753 000 34 345 000 4 772 000 -131 -131 255 82 = 173 124 -95 = - -95 4 801 000 772 4 029 000 4 029 000 2020 66 31-May-2020 12 Months Updated 31-May-2020 Millions vinnors 06-Apr-2022 U.S. Dollar 10-K AVT 24-Jul-2020 25/06/2020 20:15 Complete No NO Yes PricewaterhouseCoopers LLP Unqualified with Explanation U.S. GAAP www.cnn 37 403 000 37 403 000 37 403 000 21 162 000 21 162 000 16 241 000 13 126 000 9 534 000 3 592 000 405 405 .com 34 693 000 2 710 000 -151 -151 - 137 62 75 -14 191 191 2 887 000 348 2 539 000 2 539 000 = 2021 96 31-May-2021 12 Months Updated 31-May-2021 Millions vinnors 09-Jan-2022 Ovaircuss U.S. Dollar 10-K 20-Jul-2021 24/06/2021 20:18 Complete No Yes PricewaterhouseCoopers LLP cewatembosco.com Unqualified with Explanation U.S. GAAP 44 538 000 44 538 000 44 538 000 24 541 000 24 541 000 19 997 000 12 811 000 9 697 000 3 114 000 299 249 50 37 651 000 6 887 000 -296 -296 200 34 34 - - -262 36 36 6 661 000 934 5 727 000 5 727 000 - Extraordinary Item Total Extraordinary Items Net Income Income Available to Com Excl Extraord Income Available to Com Incl Extraord Basic Weighted Average Shares Basic EPS Excluding Extraordinary Items Basic EPS Including Extraordinary Items Extruding www.wang Diluted Net Income www.m B Diluted Weighted Average Shares weighted Average Diluted EPS Excluding ExtraOrd Items pero entroans ENTON Diluted EPS Including ExtraOrd Items including Extras Supplemental ($ Thousands) wwwwwww DPS - Common Stock Primary Issue common com Sommary Gross Dividends - Common Stock orvidends-common Total Special Items opeana meme Normalized Income Before Taxes weee mcone DCIVIC Effect of Special Items on Income Taxes Special Rems On G Inc Tax Ex Impact of Sp Items Tax Ex Impact Normalized Income After Taxes msom BOLUNG Normalized Inc. Avail to Com. Basic Normalized EPS Diluted Normalized EPS B www Amort of Intangibles, Supplemental or mange Suppleme Depreciation, Supplemental Interest Expense, Supplemental Interest Capitalized, Supplemental Rental Expense, Supplemental Stock-Based Compensation, Supplemental Variable Operating Lease Expenses Advertising Expense, Supplemental Income Taxes - Non-Recurring Tax Change Andia Came Audit Fees Audit-Related Fees Polsted T Tax Fees All Other Fees All Other Normalized EBIT Normalized EBITDA Tax & Pension Items ($ Thousands) Current Tax - Total Current Tax - Domestic Current Toy Forcier Current Tax - Foreign Current Tax - Local Toy-Total Deferred Tax - Total Deferred Tax - Domestic Deferred Tax-Foreign Deferred Tax - Local Income Tax Total Income Tax - Total Total Pension Expense Defined Contribution Expense - Domestic Dividends and Capital Changes Nike Ord Shs Class B -----------* --- ----5--838 ---------------------] --(93 -11--3---0-| ----|| -----------0-----0!! ]---- ----------** -***** $-***--* 1933 000 -130 -708 533 45 489 437 27 25 359 139 139 738 74 608 56 34 -33 76 -9 772 127 127 40 015 728 -109 756 81 -380 334 -231 -102 -47 348 107 107 5 727 000 299 00 01 01 02 102 103 ... 104 100 o 105 200 106 100 107 197 00 108 108 200 109 109 110 10 20 #11] 11 ... 12 ... 15 #13] #14 19 115 #15 15 .. #16] 10 #17 ww #18 10 #19 10 10 20 #21 21 20 #22 14 12 #23 12 126 24 120 115 25 19 16 #26 20 1 #27 #28 #29 #30 #31 #32 #33 #35 36 37 38 139 40 41 42 143 144 145 146 147 148 149 50 #51 Erfect or Special items on Income Taxes Inc Tax Ex Impact of Sp Items Normalized Income After Taxes Normalized Inc. Avail to Com. Basic Normalized EPS Diluted Normalized EPS Amort of Intangibles, Supplemental Depreciation, Supplemental wasiony deppisime Interest Expense, Supplemental Interest Capitalized, Supplemental er est capitalized supplement Rental Expense, Supplemental B Stock-Based Compensation, Supplemental compensatory Variable Operating Lease Expenses perdang Advertising Expense, Supplemental B Income Taxes - Non-Recurring Tax Change www.comm Audit Fees Audit-Related Fees Tax Fees Da All Other Fees Normalized EBIT Normalized EBITDA Tax & Pension Items ($ Thousands) Canon Kam Current Tax - Total currer Current Tax - Domestic Current Tax-Foreign Foreig warrang Current Tax - Local Deferred Tax - Total Deferred Tax - Domestic Deferred Tax - Foreign Deferred Tax - Local Income Tax - Total Total Pension Expense Defined Contribution Expense - Domestic Dividends and Capital Changes Nike Ord Shs Class B Cash Dividend Buyback Dividends & Capital Changes After May-2021 Nike Ord Shs Class B 2022 2021 Cash Dividend Cash Dividend 646 4 240 000 4 240 000 2.56 2.51 10 706 = 82 -39 731 215 - 3 341 000 - 20 6 16 100 4 749 000 5 465 000 919 398 439 82 -273 -279 15 9 -9 646 143 143 $0.18 I (11-May) Ann. $0.18 1 (16-Feb) Ann. $0.18 F (17-Nov) Ann. $0.16 I (11-Aug) Ann. $0.31 1 (10-Feb) Ann. $0.31 F (18-Nov) Ann. $0.281 (05-Aug) Ann. 359 3 966 000 3 966 000 2.44 2.39 27 747 124 -25 820 218 3 577 000 2 033 000 20 3 0 13 100 4 445 000 5 219 000 $0.20 1 (10-May) Ann. $0.20 1 (15-Feb) Ann. $0.20 F (16-Nov) Ann. $0.18 I (10-Aug) Ann. 772 4 029 000 4 029 000 2.55 2.49 15 705 131 - 829 325 3 753 000 22 1 100 14 300 4 772 000 5 492 000 738 74 608 56 34 -33 76 8 -9 772 127 127 $0.22 1 (09-May) Ann. $0.22 1 (14-Feb) Ann. $0.22 F (15-Nov) Ann. $0.20 1 (09-Aug) Ann. 1x (01-Mar) 48 819 396 819 2 895 181 2 895 181 1.86 1.82 721 151 569 429 337 3 592 000 - 21 100 600 700 3 115 000 3 836 000 728 -109 756 20% 81 = -380 -231 -102 -47 348 107 107 $0.25 1 (07-May) Ann. $0.25 1 (13-Feb) Ann. $0.25 F (14-Nov) Ann. $0.22 1 (08-Aug) Ann. ----**--*-***** ******* (06-May) Ann. (11-Feb) Ann. (20-Nov) Ann. (06-Aug) Ann. A3 Industry - Annual Standardised in Thousands of U.S. Dollan Earnings Quality Score Period End Date Update Type Statement Date Reporting Unit Update Date Reporting Currency Source Source Date Original Announcement Date Complete Statement Flash Update Consolidated Auditor Name Auditor Opinion Accounting Standard Assets ($ Thousands) Cash and Short Term Investments Cash & Equivalents Short Term Investments Accounts Receivable - Trade Net Accounts Receivable - Trade Gross Provision for Doubtful Accounts Total Receivables Net Total Inventory Inventories - Finished Goods Prepaid Expenses Other Current Assets Total Other Current Assets Total Current Assets Property/Plant/Equipment Total - Gross Buildings - Gross Land/Improvements - Gross Machinery/Equipment - Gross Construction in Progress - Gross Other Property/Plant/Equipment - Gross Property/Plant/Equipment Total - Net Accumulated Depreciation Total Goodwill Net Intangibles Net Intangibles - Gross Accumulated Intangible Amortization Other Long Term Assets Total Defered Income Tax - Long Term Asset kalau Tamanka fx Balance Sheet 2017 80 31-May-2017 Updated 31-May-2017 Millions 09-Jan-2022 U.S. Dollar 10-K 20-Jul-2017 29/06/2017 17:00 Complete No Yes PricewaterhouseCoopers LLP Unqualified U.S. GAAP 6 179 000 3 808 000 2 371 000 3 677 000 3 696 000 -19 3 677 000 5 055 000 5 055 000 933 217 217 16 061 000 7 958 000 3 048 000 285 3 867 000 758 3 989 000 -3 969 000 139 283 300 -17 2 787 000 2 763 000 24 2018 90 31-May-2018 Updated 31-May-2018 Millions 09-Jan-2022 U.S. Dollar 10-K 25-Jul-2018 28/06/2018 20:19 Complete No Yes PricewaterhouseCoopers LLP Unqualified U.S. GAAP 5 245 000 4 249 000 996 3 498 000 3 528 000 -30 3 498 000 5 261 000 5 261 000 890 240 240 15 134 000 8 891 000 3 689 000 331 4 230 000 641 4 454 000 -4 437 000 154 285 303 -18 2 509 000 2 349 000 ACO D 2019 94 31-May-2019 Updated 31-May-2019 Millions 10-Jan-2022 U.S. Dollar 10-K 23-Jul-2019 27/06/2019 20:15 Complete No Yes PricewaterhouseCoopers LLP Unqualified with Explanation U.S. GAAP 4 663 000 4 466 000 197 4 272 000 4 302 000 -30 4 272 000 5 622 000 5 622 000 1 352 000 616 616 16 525 000 9 469 000 4 008 000 329 4 335 000 797 4 744 000 -4 725 000 154 283 303 -20 2011 000 2 005 000 C 2020 66 31-May-2020 Updated 31-May-2020 Millions 06-Apr-2022 U.S. Dollar 10-K 24-Jul-2020 25/06/2020 20:15 Complete No Yes PricewaterhouseCoopers LLP Unqualified with Explanation U.S. GAAP 8 787 000 8 348 000 439 2 749 000 2 963 000 -214 2 749 000 7 367 000 7 367 000 1 653 000 20 556 000 12 758 000 3 996 000 345 4 234 000 1 086 000 3 097 000 7 963 000 -4 795 000 223 274 293 -19 2 326 000 2 326 000 F 2021 96 31-May-2021 Updated 31-May-2021 Millions 09-Jan-2022 U.S. Dollar 10-K 20-Jul-2021 24/06/2021 20:18 Complete No Yes PricewaterhouseCoopers LLP Unqualified with Explanation U.S. GAAP 13 476 000 9 889 000 3 587 000 4 463 000 4 556 000 -93 4463 000 6 854 000 6 854 000 1 498 000 26 291 000 13 174 000 4 973 000 363 4 414 000 311 3 113 000 8 017 000 -5 157 000 242 269 296 -27 2 921 000 2 921 000 A3 fx Balance Sheet 217 217 16 061 000 7 958 000 3 048 000 285 3 867 000 758 - 3 989 000 -3 969 000 139 283 300 -17 2 787 000 2 763 000 24 23 259 000 2 048 000 2 375 000 325 6 720 300 84 336 5 474 000 3 471 000 3471 000 3 802 000 1821 000 1 821 000 86 86 10 852 000 0 0 3 x fx A Other Current Assets Total Other Current Assets Total Current Assets Property/Plant/Equipment Total - Gross Buildings - Gross Land/Improvements - Gross Machinery/Equipment - Gross Construction in Progress - Gross Other Property/Plant/Equipment - Gross Property/Plant/Equipment Total - Net Accumulated Depreciation Total Goodwill Net Intangibles Net Intangibles - Gross Accumulated Intangible Amortization Other Long Term Assets Total Defered Income Tax - Long Term Asset Other Long Term Assets Total Assets Liabilities ($ Thousands) Accounts Payable Accrued Expenses Notes Payable/Short Term Debt Current Port. of LT Debt/Capital Leases Other Current liabilities Total Dividends Payable Income Taxes Payable Other Current Liabilities Total Current Liabilities Total Long Term Debt Long Term Debt Total Debt Deferred Income Tax Deferred Income Tax - LT Liability Other Liabilities Total Other Long Term Liabilities Total Liabilities Shareholders Equity ($ Thousands) Redeemable Preferred Stock Total Redeemable Preferred Stock Common Stock Total A 240 240 15 134 000 8 891 000 3 689 000 331 4 230 000 641 - 4 454 000 -4 437 000 154 285 303 -18 2 509 000 2 349 000 160 22 536 000 2 279 000 2 558 000 336 6 861 320 150 391 6 040 000 3 468 000 3 468 000 3 810 000 3 210 000 3 210 000 6 6 12 724 000 0 0 3 616 616 16 525 000 9 469 000 4 008 000 329 4 335 000 797 4 744 000 -4 725 000 154 283 303 -20 2011 000 2 005 000 6 23 717 000 2 612 000 4 271 000 9 6 968 346 229 393 7 866 000 3 464 000 3 464 000 3 479 000 3 345 000 3 345 000 2 2 14 677 000 0 0 3 - 20 556 000 12 758 000 3 996 000 345 4 234 000 1 086 000 3 097 000 7 963 000 -4 795 000 223 274 293 -19 2 326 000 2 326 000 31 342 000 2 248 000 4 504 000 248 3 1 281 000 384 156 741 8 284 000 9 406 000 9 406 000 9 657 000 2 684 000 2 684 000 2 913 000 2 913 000 23 287 000 0 0 3 ~ 26 291 000 13 174 000 4 973 000 363 4 414 000 311 3 113 000 8 017 000 -5 157 000 242 269 296 -27 2 921 000 2 921 000 37 740 000 2 836 000 6 172 000 2 0 664 306 358 9 674 000 9413 000 9 413 000 9 415 000 2 955 000 2 955 000 2 931 000 2 931 000 24 973 000 0 0 3 A A3 X fx Balance Sheet 80 10 852 000 0 Other Long Term Drabilities Total Liabilities Shareholders Equity ($ Thousands) Redeemable Preferred Stock Total Redeemable Preferred Stock Common Stock Total Common Stock Additional Paid-In Capital Retained Earnings (Accumulated Deficit) Other Equity Total Translation Adjustment Other Comprehensive Income Total Equity Total Liabilities & Shareholders' Equity Supplemental ($ Thousands) Shares Outstanding - Common Issue 2 Total Common Shares Outstanding Shares Outs - Common Stock Primary Issue Treas Shares - Common Stock Prmry Issue Treasury Shares - Common Issue 2 Total Equity & Minority Interest Full-Time Employees Number of Common Shareholders Goodwill - Net Accumulated Intangible Amort Suppl. Wgt Avg Rem Lease Term (Yrs)-Oper Lease Wgt Avg Disc Rate - Operating Lease Right-of-Use Assets-Op.Lease Gross-Sup. Curr Port of LT Operating Leases Suppl. Long-Term Operating Lease Liabs. Suppl. Curr Derivative Liab. Hedging Suppl. Non-Curr Derivative Liab. Hedging Suppl Total Current Assets less Inventory Net Debt Incl. Pref.Stock & Min.Interest Tangible Book Value Common Equity Debt & Lease Pension Items ($ Thousands) Total Long Term Debt Supplemental Long Term Debt Maturing within 1 Year Long Term Debt Maturing in Year 2 Long Term Debt Maturing in Year 3 Long Term Debt Maturing in Year 4 Long Term Debt Maturing in Year 5 Long Term Debt Maturing in 2-3 Years 0 3 3 8 638 000 3 979 000 -213 -191 -22 12 407 000 23 259 000 329 1643 000 1 314 000 0 0 12 407 000 744 22 713 139 17 -- -- 336 86 11 006 000 -2 377 000 11 985 000 5 888 000 115 115 115 112 109 230 D 12 724 000 0 0 3 3 6 384 000 3 517 000 -92 -173 81 9 812 000 22 536 000 329 1 601 000 1 272 000 0 0 9 812 000 73 1 22 286 154 18 - 391 6 9 873 000 -1 435 000 9 373 000 5 773 000 115 115 112 109 609 227 D 2 14 677 000 0 0 3 3 7 163 000 1 643 000 231 -346 577 9 040 000 23 717 000 315 1568 000 1 253 000 0 0 9 040 000 76 7 23 318 154 20 -- -- -- 393 2 10 903 000 -1 184 000 8 603 000 5 660 000 115 112 109 609 98 221 2913 VUU 23 287 000 0 0 3 3 8 299 000 -191 -56 -494 438 8 055 000 31 342 000 315 1558 000 1 243 000 0 0 8 055 000 75 4 23 114 223 19 87 24 3 097 000 445 2 913 000 595 13 189 000 870 7 558 000 14 452 000 289 286 786 275 1 275 000 1 072 000 2931 000 24 973 000 0 0 3 3 9 965 000 3 179 000 -380 2 -382 12 767 000 37 740 000 305 1 578 000 1 273 000 0 0 12 767 000 73 3 22 745 242 27 83 23 3 113 000 467 2 931 000 358 19 437 000 -4 061 000 12 256 000 14 163 000 286 786 275 1 275 000 251 1.061.000 43 fx Balance Sheet B 12 407 000 744 22 713 139 17 . - 336 86 11 006 000 -2 377 000 11 985 000 5 888 000 115 115 115 112 109 230 221 5322 000 370 34 32 28 25 26 60 51 225 3 905 000 537 509 438 399 350 947 749 1 672 000 Total Equity & Minority Interest Full-Time Employees Number of Common Shareholders Goodwill - Net Accumulated Intangible Amort Suppl. Wgt Avg Rem Lease Term (Yrs)-Oper Lease Wgt Avg Disc Rate - Operating Lease Right-of-Use Assets-Op.Lease Gross-Sup. Curr Port of LT Operating Leases Suppl. Long-Term Operating Lease Liabs. Suppl. Curr Derivative Liab. Hedging Suppl. Non-Curr Derivative Liab. Hedging Suppl Total Current Assets less Inventory Net Debt Incl. Pref.Stock & Min.Interest Tangible Book Value Common Equity Debt & Lease Pension Items ($ Thousands) Total Long Term Debt Supplemental Long Term Debt Maturing within 1 Year Long Term Debt Maturing in Year 2 Long Term Debt Maturing in Year 3 Long Term Debt Maturing in Year 4 Long Term Debt Maturing in Year 5 Long Term Debt Maturing in 2-3 Years Long Term Debt Maturing in 4-5 Years Long Term Debt Matur. in Year 6 & Beyond Total Capital Leases Supplemental Capital Lease Payments Due in Year 1 Capital Lease Payments Due in Year 2 Capital Lease Payments Due in Year 3 Capital Lease Payments Due in Year 4 Capital Lease Payments Due in Year 5 Capital Lease Payments Due in 2-3 Years Capital Lease Payments Due in 4-5 Years Cap. Lease Pymts. Due in Year 6 & Beyond Total Operating Leases Supplemental Operating Lease Payments Due in Year 1 Operating Lease Payments Due in Year 2 Operating Lease Payments Due in Year 3 Operating Lease Payments Due in Year 4 Operating Lease Payments Due in Year 5 Operating Lease Pymts. Due in 2-3 Years Operating Lease Pymts. Due in 4-5 Years Oper. Lse. Pymts. Due in Year 6 & Beyond Operating Leases - Interest Cost 9 812 000 731 22 286 154 18 - - 391 6 9 873 000 -1 435 000 9 373 000 5 773 000 115 115 112 109 609 227 718 4 713 000 424 44 37 40 38 36 77 74 229 3 965 000 589 523 472 412 361 995 773 1 608 000 9 040 000 76 7 23 318 154 20 -- 393 2 10 903 000 -1 184 000 8 603 000 5 660 000 115 112 109 609 98 221 707 4 617 000 374 32 34 40 37 34 74 71 197 3 732 000 553 513 441 386 345 954 731 1 494 000 8 055 000 75 4 23 114 223 19 87 24 3 097 000 445 2 913 000 595 13 189 000 870 7 558 000 14 452 000 289 286 786 275 1 275 000 1 072 000 1 550 000 11 541 000 3 358 000 550 514 456 416 374 970 790 1 048 000 -426 12 767 000 73 3 22 745 242 27 83 23 3 113 000 467 2 931 000 358 19 437 000 -4 061 000 12 256 000 14 163 000 286 786 275 1 275 000 251 1 061 000 1 526 000 11 290 000 3 398 000 534 530 490 437 357 1 020 000 794 1 050 000 -347 Cash Flow 49 50 Industry-Annual Standardised in Thousands of U.S. Dollars 151 52 Earnings Quality Score Period End Date 153 Period Length 54 55 Update Type Statement Date 56 57 Reporting Unit Reporting Unit 58 Update Date Update Date 50 59 Reporting Currency 160 60 Source Source ... Source Date 161 Codice Date Original Announcement Date Announceme ... 63 63 Complete Statement ... 64 Flash Update Consolidated 165 65 66 66 Auditor Name 67 Auditor Opinion Accounting Standard ash Flow-Operating Activities ($ Thousands) 69 Net Income/Starting Line 70 Depreciation/Depletion 171 Depreciation 172 Amortization 73 174 Amortization of Intangibles Deferred Taxes 175 Non-Cash Items 76 Unusual Items 177 Other Non-Cash Items 178 Changes in Working Capital -79 75 Accounts Receivable 180 Inventories 181 Prepaid Expenses Payable/Accrued Cash from Operating Activities 185 86 ash Flow-Investing Activities ($ Thousands) 187 Capital Expenditures Purchase of Fixed Assets 88 Other Investing Cash Flow Items Total 189 Sale of Fixed Assets 190 Sale/Maturity of Investment 191 Purchase of Investments 192 Other Investing Cash Flow 193 Cash from Investing Activities 195 ash Flow-Financing Activities ($ Thousands) 196 APL 182 183 184 194 2017 2018 31-May-2019 31-May-2017 12 Months Updated 31-May-2017 31-May-2017 12 Months Reclassified 31-May-2018 Millions 09-Jan-2022 -Jan-202 U.S. Dollar 31-May-2018 12 Months Updated 31-May-2018 66 31-May-2020 12 Months Updated 31-May-2020 1-May- 2021 96 31-May-2021 12 Months Updated 31-May-2021 Millions Minions 31-May-2019 Millions 10-Jan-2022 U.S. Dollar Millions Minions 09-Jan-2022 Millions Livimmons 09-Jan-2022 U.S. Dollar 10-K 09-Jan-2022 Millions wimmons 06-Apr-2022 U.S. Dollar U.S. Dollar U.S. Dollar 10-K 10-K BUN 20-Jul-2017 25-Jul-2018 25-Jul-2018 28/06/2018 20:19 Complete 23-Jul-2019 27/06/2019 20:15 29/06/2017 17:00 20-Jul-2021 www 24/06/2021 20:18 24-Jul-2020 25/06/2020 20:15 Complete 28/06/2018 20:19 Complete Complete Complete No No Yes Yes Yes Yes ricewaterhouseCoopers LLP PricewaterhouseCoopers LLP PricewaterhouseCoopers LLP PricewaterhouseCoopers LLP PricewaterhouseCoopers LLP PricewaterhouseCoopers LLP Unqualified Unqualified Unqualified with Explanation Unqualified with Explanation Inqualified with Explanation U.S. GAAP U.S. GAAP U.S. GAAP Unqualified U.S. GAAP U.S. GAAP 4 240 000 4 240 000 2 539 000 5 727 000 706 744 706 721 744 10 53 10 -273 -385 473 98 -117 -138 215 429 611 -1 141 000 -1 245 000 -426 1 239 000 -1 606 000 507 -231 -1 854 000 -120 -364 24 -182 1326 000 6 657 000 3 640 000 2 485 000 -1 105 000 -1 086 000 -695 -695 -1 105 000 -1 086 000 58 97 -3 105 000 13 6 046 000 2 453 000 -5 928 000 -2 426 000 31 6 685 000 -9 961 000 171 -34 -1 008 000 -1 028 000 -3 800 000 ID-L 3 846 000 H -1 105 000 -1 105 000 6 046 000 -5 928 000 -1 008 000 P *-*********|| ||--||-- 1933 000 747 747 647 119 -99 218 1 482 000 187 -255 1515 000 4 955 000 -1 028 000 -1 028 000 1304 000 3 6 109 000 -4 783 000 -25 276 MLA LOL II OUL Non-Cash Items Unusual Items Other Non-Cash Items Changes in Working Capital Accounts Receivable Inventories Prepaid Expenses Payable/Accrued Cash from Operating Activities ash Flow-Investing Activities ($ Thousands) Capital Expenditures Purchase of Fixed Assets Other Investing Cash Flow Items Total Sale of Fixed Assets Sale/Maturity of Investment Purchase of Investments Other Investing Cash Flow Cash from Investing Activities ash Flow-Financing Activities ($ Thousands) Financing Cash Flow Items Other Financing Cash Flow Total Cash Dividends Paid Issuance (Retirement) of Stock Net Repurchase/Retirement of Common Common Stock Net Options Exercised Issuance (Retirement) of Debt Net Short Term Debt Net Long Term Debt Issued Long Term Debt Reduction Long Term Debt Net Cash from Financing Activities Foreign Exchange Effects Net Change in Cash Net Cash - Beginning Balance Net Cash - Ending Balance Cash Interest Paid Cash Taxes Paid Net Changes in Working Capital Free Cash Flow 98 -117 215 -1 141 000 -426 -231 -120 -364 3 640 000 -1 105 000 -1 105 000 97 13 6 046 000 -5 928 000 -34 -1 008 000 177 177 -1 133 000 -2 734 000 -3 223 000 -3 223 000 489 1 748 000 327 1482 000 -61 1421 000 -1 942 000 -20 670 3 138 000 3 808 000 98 703 -1 141 000 2.535 000 ***** BUMB -117 -935 -426 -231 -120 -158 3 846 000 -1 105 000 -1 105 000 6 046 000 -5 928 000 -1 008 000 -1 133 000 -2 734 000 -3 223 000 -3 223 000 1748000 1482000 1421 000 -2 148 000 3 138 000 3 808 000 -935 2 741 000 119 -99 218 1482 000 187 -255 35 1515 000 4 955 000 -1 028 000 -1 028 000 1304 000 3 6 109 000 -4 783 000 -25 276 -55 -55 -1 243 000 -3 521 000 -4 254 000 -4 254 000 733 -16 13 0 -29 -29 -4 835 000 45 441 3 808 000 4 249 000 125 529 1482 000 3 927 000 ****** W-H - HHHHHHH -270 -490 -203 1525 000 5 903 000 -1 119 000 -1 119 000 3 787 000 -2 937 000 -264 -1 332 000 -3 586 000 -4 286 000 -4 286 000 -358 -325 -5 293 000 4 249 000 4 466 000 757 562 4784 000 850 -1 245 000 1 239 000 -1 854 000 -654 2 485 000 -1 086 000 -1 086 000 2 453 000 -2 426 000 -1 028 000 -1 452 000 -2 182 000 -3 067 000 -3 067 000 885 6 183 000 6 134 000 6 134 000 2 491 000 3 882 000 4 466 000 8 348 000 140 1028 000 -1 245 000 1399 000 473 -138 611 45 -1 606 000 507 -182 1 326 000 6 657 000 -695 -695 -3 105 000 6 685 000 -9 961 000 171 -3 800 000 -136 -136 -1 638 000 564 -608 -608 1 172 000 -249 -52 0 -197 -197 -1 459 000 143 1 541 000 8 348 000 9 889 000 293 1 177 000 45 5.962 000 Income Statement Industry-Annual Standardised in Thousands of U.S. Dolars Earnings Quality Score Period End Date Period Length Update Type Statement Date Reporting Unit aporam Opdate Update Date Reporting Currency orting con Source Source Date www.co Original Announcement Date Complete Statement implete Flash Update wat opdate Consolidated wide.co Auditor Name Auditor Opinion muun.com Accounting Standard unting Revenue NCYCINE Net Sales Total Revenue Cost of Revenue, Total Cost of Revenue Gross Profit Selling/General/Admin. Expenses, Total Selling/General/Administrative Expense Labor & Related Expense Advertising Expense Unusual Expense (Income) Restructuring Charge www. Impairment-Assets Held for Use mamans Papers Other Unusual Expense (Income) Japan Pa Total Operating Expense Operating Income Interest Expense, Net Non-Operating than.com p Interest Expense - Non-Operating w Interest Capitalized - Non-Operating Interest/Invest Income - Non-Operating Interest Income - Non-Operating Investment Income - Non-Operating Interest Inc.(Exp.), Net-Non-Op., Total Other, Net Other Non-Operating Income (Expense) Net Income Before Taxes Provision for Income Taxes Net Income After Taxes Net Income Before Extra. Items Extraordinary Item Total Extraordinary Items 2017 80 31-May-2017 12 Months Updated 31-May-2017 Millions winnons 09-Jan-2022 9-9an-2022 U.S. Dollar 10-K 20% 20-Jul-2017 29/06/2017 17:00 Complete No - Yes Tes PricewaterhouseCoopers LLP Unqualified U.S. GAAP Barackm 34 350 000 34 350 000 34 350 000 19 038 000 19 038 000 15 312 000 10 563 000 7 007 000 215 3 341 000 29 601 000 4 749 000 -82 -121 39 - 176 27 - 149 94 43 43 4 886 000 646 4 240 000 4 240 000 2 2018 90 31-May-2018 12 Months Updated 31-May-2018 Millions 09-Jan-2022 U.S. Dollar 10-K 25-Jul-2018 28/06/2018 20:19 Complete No - Yes PricewaterhouseCoopers LLP Unqualified U.S. GAAP 36 397 000 36 397 000 36 397 000 20 441 000 20 441 000 15 956 000 11 511 000 7 716 000 218 3 577 000 31 952 000 4 445 000 -124 -149 25 9 = 70 -61 - -115 -5 = -5 4 325 000 359 3 966 000 3 966 000 -2 033 000 -2 033 000 2019 94 31-May-2019 12 Months Updated 31-May-2019 Millions 10-Jan-2022 U.S. Dollar 10-K 23-Jul-2019 27/06/2019 20:15 Complete No Yes PricewaterhouseCoopers LLP Unqualified with Explanation U.S. GAAP www.anni 39 117 000 39 117 000 39 117 000 21 643 000 21 643 000 17 474 000 12 702 000 8 949 000 3 753 000 34 345 000 4 772 000 -131 -131 255 82 = 173 124 -95 = - -95 4 801 000 772 4 029 000 4 029 000 2020 66 31-May-2020 12 Months Updated 31-May-2020 Millions vinnors 06-Apr-2022 U.S. Dollar 10-K AVT 24-Jul-2020 25/06/2020 20:15 Complete No NO Yes PricewaterhouseCoopers LLP Unqualified with Explanation U.S. GAAP www.cnn 37 403 000 37 403 000 37 403 000 21 162 000 21 162 000 16 241 000 13 126 000 9 534 000 3 592 000 405 405 .com 34 693 000 2 710 000 -151 -151 - 137 62 75 -14 191 191 2 887 000 348 2 539 000 2 539 000 = 2021 96 31-May-2021 12 Months Updated 31-May-2021 Millions vinnors 09-Jan-2022 Ovaircuss U.S. Dollar 10-K 20-Jul-2021 24/06/2021 20:18 Complete No Yes PricewaterhouseCoopers LLP cewatembosco.com Unqualified with Explanation U.S. GAAP 44 538 000 44 538 000 44 538 000 24 541 000 24 541 000 19 997 000 12 811 000 9 697 000 3 114 000 299 249 50 37 651 000 6 887 000 -296 -296 200 34 34 - - -262 36 36 6 661 000 934 5 727 000 5 727 000 - Extraordinary Item Total Extraordinary Items Net Income Income Available to Com Excl Extraord Income Available to Com Incl Extraord Basic Weighted Average Shares Basic EPS Excluding Extraordinary Items Basic EPS Including Extraordinary Items Extruding www.wang Diluted Net Income www.m B Diluted Weighted Average Shares weighted Average Diluted EPS Excluding ExtraOrd Items pero entroans ENTON Diluted EPS Including ExtraOrd Items including Extras Supplemental ($ Thousands) wwwwwww DPS - Common Stock Primary Issue common com Sommary Gross Dividends - Common Stock orvidends-common Total Special Items opeana meme Normalized Income Before Taxes weee mcone DCIVIC Effect of Special Items on Income Taxes Special Rems On G Inc Tax Ex Impact of Sp Items Tax Ex Impact Normalized Income After Taxes msom BOLUNG Normalized Inc. Avail to Com. Basic Normalized EPS Diluted Normalized EPS B www Amort of Intangibles, Supplemental or mange Suppleme Depreciation, Supplemental Interest Expense, Supplemental Interest Capitalized, Supplemental Rental Expense, Supplemental Stock-Based Compensation, Supplemental Variable Operating Lease Expenses Advertising Expense, Supplemental Income Taxes - Non-Recurring Tax Change Andia Came Audit Fees Audit-Related Fees Polsted T Tax Fees All Other Fees All Other Normalized EBIT Normalized EBITDA Tax & Pension Items ($ Thousands) Current Tax - Total Current Tax - Domestic Current Toy Forcier Current Tax - Foreign Current Tax - Local Toy-Total Deferred Tax - Total Deferred Tax - Domestic Deferred Tax-Foreign Deferred Tax - Local Income Tax Total Income Tax - Total Total Pension Expense Defined Contribution Expense - Domestic Dividends and Capital Changes Nike Ord Shs Class B -----------* --- ----5--838 ---------------------] --(93 -11--3---0-| ----|| -----------0-----0!! ]---- ----------** -***** $-***--* 1933 000 -130 -708 533 45 489 437 27 25 359 139 139 738 74 608 56 34 -33 76 -9 772 127 127 40 015 728 -109 756 81 -380 334 -231 -102 -47 348 107 107 5 727 000 299 00 01 01 02 102 103 ... 104 100 o 105 200 106 100 107 197 00 108 108 200 109 109 110 10 20 #11] 11 ... 12 ... 15 #13] #14 19 115 #15 15 .. #16] 10 #17 ww #18 10 #19 10 10 20 #21 21 20 #22 14 12 #23 12 126 24 120 115 25 19 16 #26 20 1 #27 #28 #29 #30 #31 #32 #33 #35 36 37 38 139 40 41 42 143 144 145 146 147 148 149 50 #51 Erfect or Special items on Income Taxes Inc Tax Ex Impact of Sp Items Normalized Income After Taxes Normalized Inc. Avail to Com. Basic Normalized EPS Diluted Normalized EPS Amort of Intangibles, Supplemental Depreciation, Supplemental wasiony deppisime Interest Expense, Supplemental Interest Capitalized, Supplemental er est capitalized supplement Rental Expense, Supplemental B Stock-Based Compensation, Supplemental compensatory Variable Operating Lease Expenses perdang Advertising Expense, Supplemental B Income Taxes - Non-Recurring Tax Change www.comm Audit Fees Audit-Related Fees Tax Fees Da All Other Fees Normalized EBIT Normalized EBITDA Tax & Pension Items ($ Thousands) Canon Kam Current Tax - Total currer Current Tax - Domestic Current Tax-Foreign Foreig warrang Current Tax - Local Deferred Tax - Total Deferred Tax - Domestic Deferred Tax - Foreign Deferred Tax - Local Income Tax - Total Total Pension Expense Defined Contribution Expense - Domestic Dividends and Capital Changes Nike Ord Shs Class B Cash Dividend Buyback Dividends & Capital Changes After May-2021 Nike Ord Shs Class B 2022 2021 Cash Dividend Cash Dividend 646 4 240 000 4 240 000 2.56 2.51 10 706 = 82 -39 731 215 - 3 341 000 - 20 6 16 100 4 749 000 5 465 000 919 398 439 82 -273 -279 15 9 -9 646 143 143 $0.18 I (11-May) Ann. $0.18 1 (16-Feb) Ann. $0.18 F (17-Nov) Ann. $0.16 I (11-Aug) Ann. $0.31 1 (10-Feb) Ann. $0.31 F (18-Nov) Ann. $0.281 (05-Aug) Ann. 359 3 966 000 3 966 000 2.44 2.39 27 747 124 -25 820 218 3 577 000 2 033 000 20 3 0 13 100 4 445 000 5 219 000 $0.20 1 (10-May) Ann. $0.20 1 (15-Feb) Ann. $0.20 F (16-Nov) Ann. $0.18 I (10-Aug) Ann. 772 4 029 000 4 029 000 2.55 2.49 15 705 131 - 829 325 3 753 000 22 1 100 14 300 4 772 000 5 492 000 738 74 608 56 34 -33 76 8 -9 772 127 127 $0.22 1 (09-May) Ann. $0.22 1 (14-Feb) Ann. $0.22 F (15-Nov) Ann. $0.20 1 (09-Aug) Ann. 1x (01-Mar) 48 819 396 819 2 895 181 2 895 181 1.86 1.82 721 151 569 429 337 3 592 000 - 21 100 600 700 3 115 000 3 836 000 728 -109 756 20% 81 = -380 -231 -102 -47 348 107 107 $0.25 1 (07-May) Ann. $0.25 1 (13-Feb) Ann. $0.25 F (14-Nov) Ann. $0.22 1 (08-Aug) Ann. ----**--*-***** ******* (06-May) Ann. (11-Feb) Ann. (20-Nov) Ann. (06-Aug) Ann