Answered step by step
Verified Expert Solution
Question
1 Approved Answer
please do A, B and C You ore looking at a population and are interested in the proportion p that has a certain charecteristic. Unknown
please do A, B and C 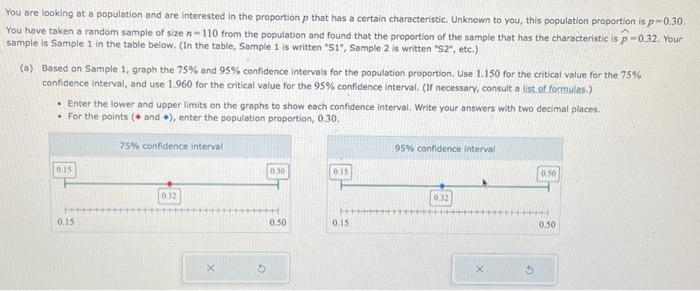
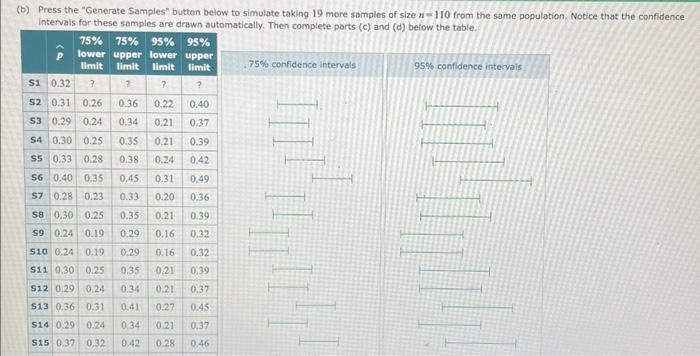
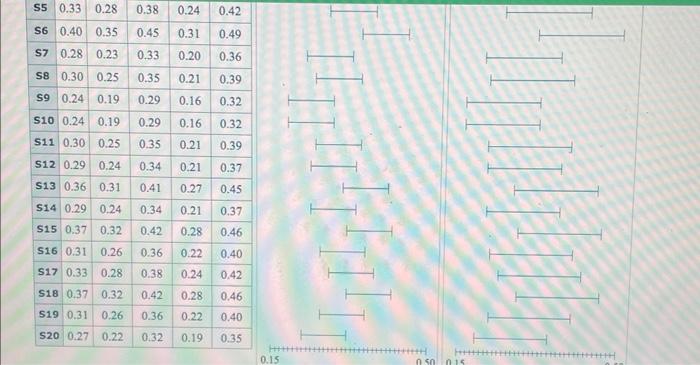
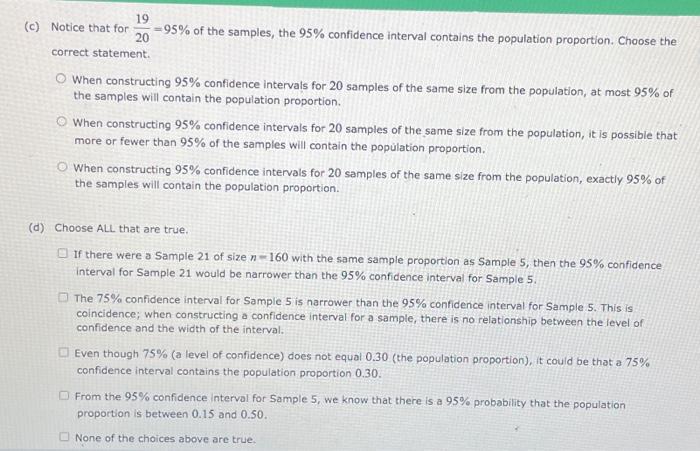
You ore looking at a population and are interested in the proportion p that has a certain charecteristic. Unknown to you, this population proportion is p=0.30. You have taken a random sample of size n=110 from the population and found that the proportion of the sample that has the characteristic is p. 0 .32. Your sample is Sample 1 in the table below. (In the table, Sample 1 is written "S1", Sample 2 is written "S2", etc.) (a) Based on Sample 1, groph the 75% and 95% confidence intervals for the population proportion. Use 1.150 for the critical value for the 75% confidence interval, and use 1.960 for the critical value for the 95% confidence interval. (If necessary, consult a list of formulas.) - Enter the lower and upper limits on the graphs to show each confidence interval. Write your answers with two deoimal places. - For the points ( and ), enter the population proportion, 0.30. (b) Press the "Generate Samples" button below to simulate taking 19 more samples of size n= 110 from the same population. Notice that the confidence intervals for these samples are drawn automatically. Then complete parts (c) and (d) below the table. \begin{tabular}{|l|l|l|l|l|l|} \hline s5 & 0.33 & 0.28 & 0.38 & 0.24 & 0.42 \\ \hline s6 & 0.40 & 0.35 & 0.45 & 0.31 & 0.49 \\ \hline s7 & 0.28 & 0.23 & 0.33 & 0.20 & 0.36 \\ \hline s8 & 0.30 & 0.25 & 0.35 & 0.21 & 0.39 \\ \hline s9 & 0.24 & 0.19 & 0.29 & 0.16 & 0.32 \\ \hline s10 & 0.24 & 0.19 & 0.29 & 0.16 & 0.32 \\ \hline s11 & 0.30 & 0.25 & 0.35 & 0.21 & 0.39 \\ \hline s12 & 0.29 & 0.24 & 0.34 & 0.21 & 0.37 \\ \hline s13 & 0.36 & 0.31 & 0.41 & 0.27 & 0.45 \\ \hline s14 & 0.29 & 0.24 & 0.34 & 0.21 & 0.37 \\ \hline S15 & 0.37 & 0.32 & 0.42 & 0.28 & 0.46 \\ \hline s16 & 0.31 & 0.26 & 0.36 & 0.22 & 0.40 \\ \hline s17 & 0.33 & 0.28 & 0.38 & 0.24 & 0.42 \\ \hline s18 & 0.37 & 0.32 & 0.42 & 0.28 & 0.46 \\ \hline s19 & 0.31 & 0.26 & 0.36 & 0.22 & 0.40 \\ \hline s20 & 0.27 & 0.22 & 0.32 & 0.19 & 0.35 \\ \hline \end{tabular} correct statement. When constructing 95% confidence intervals for 20 samples of the same size from the population, at most 95% of the samples will contain the population proportion. When constructing 95% confidence intervals for 20 samples of the same size from the population, it is possible that more or fewer than 95% of the samples will contain the population proportion. When constructing 95% confidence intervals for 20 samples of the same size from the population, exactly 95% of the samples will contain the population proportion. (d) Choose AlL that are true. If there were a Sample 21 of size n=160 with the same sample proportion as Sample 5 , then the 95% confidence interval for Sample 21 would be narrower than the 95% confidence interval for Sample 5. The 75% confidence interval for Sample 5 is narrower than the 95% confidence interval for Sample 5 . This is coincidence; when constructing a confidence interval for a sample, there is no relationship between the level of confidence and the width of the interval. Even though 75% (a level of confidence) does not equal 0.30 (the population proportion), it could be that a 75% confidence interval contains the population proportion 0.30. From the 95% confidence interval for Sample 5, we know that there is a 95% probability that the population proportion is between 0.15 and 0.50. None of the choices above are true 


Step by Step Solution
There are 3 Steps involved in it
Step: 1

Get Instant Access to Expert-Tailored Solutions
See step-by-step solutions with expert insights and AI powered tools for academic success
Step: 2

Step: 3

Ace Your Homework with AI
Get the answers you need in no time with our AI-driven, step-by-step assistance
Get Started


