Please do all parts and show the work! (what functions did you use, how did you get there, why, etc.)
Thank you so much!
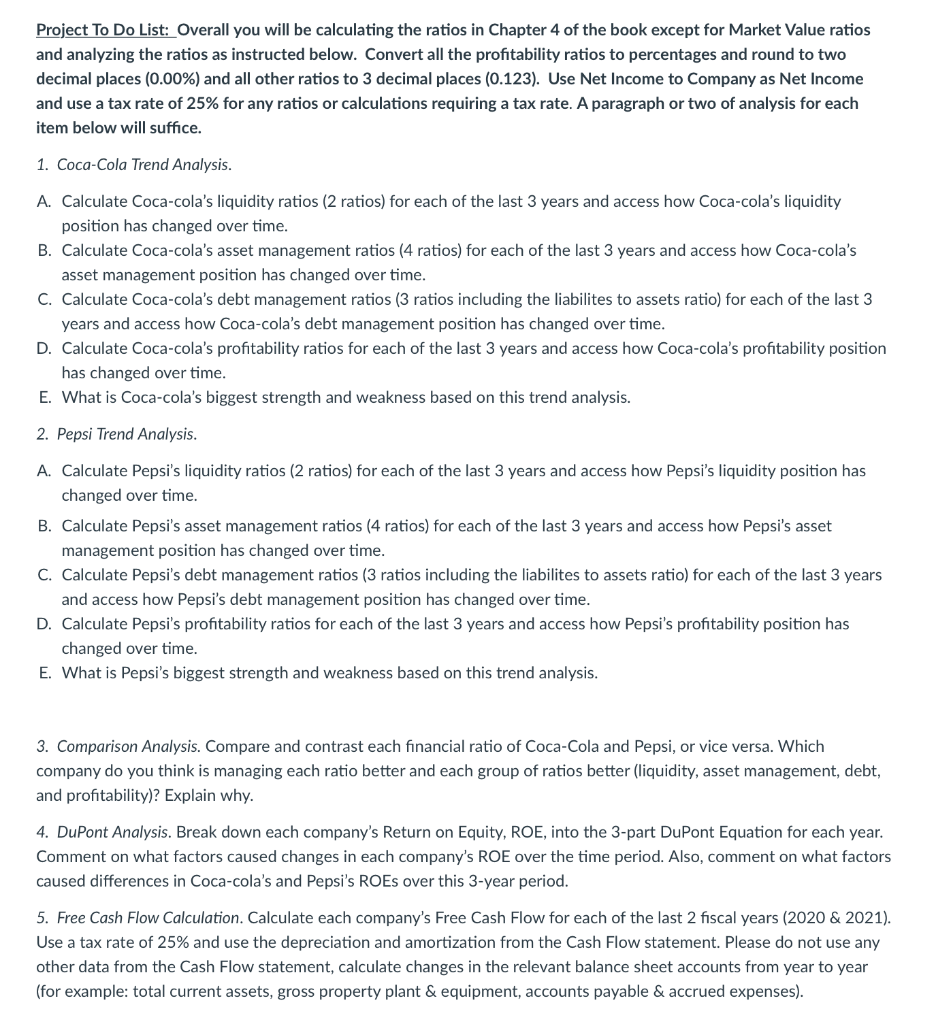
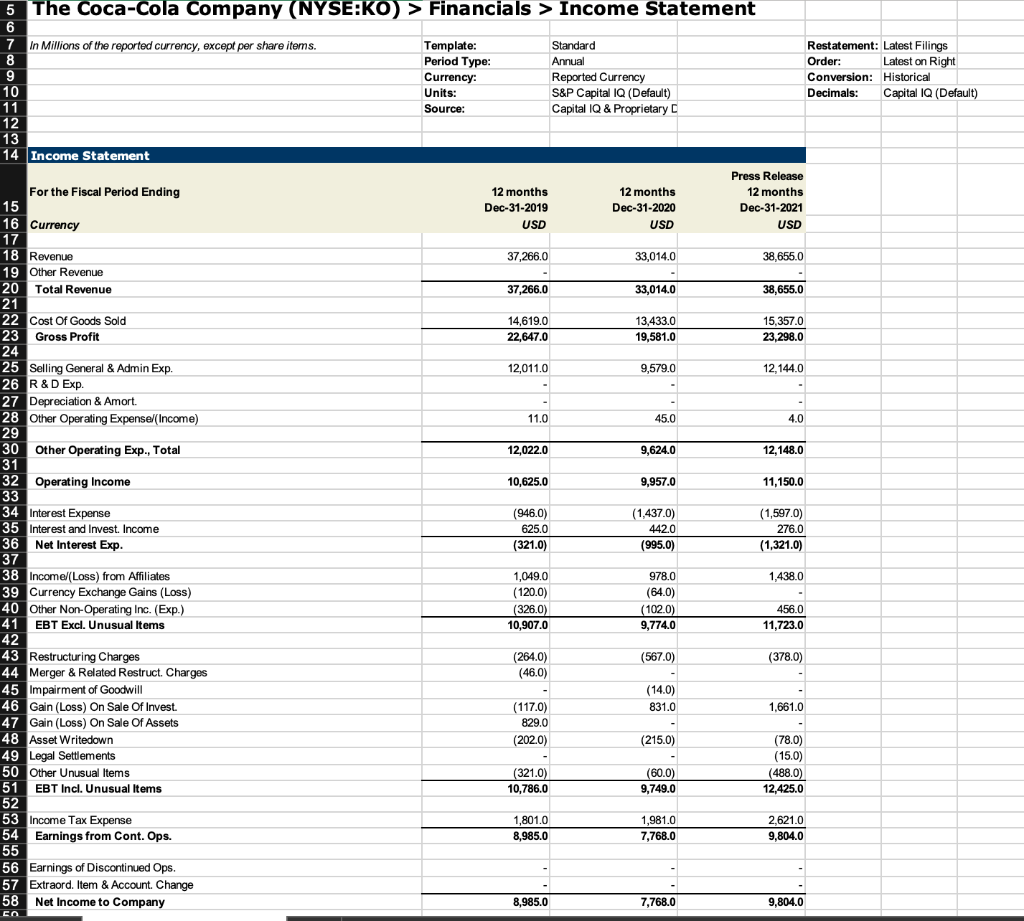
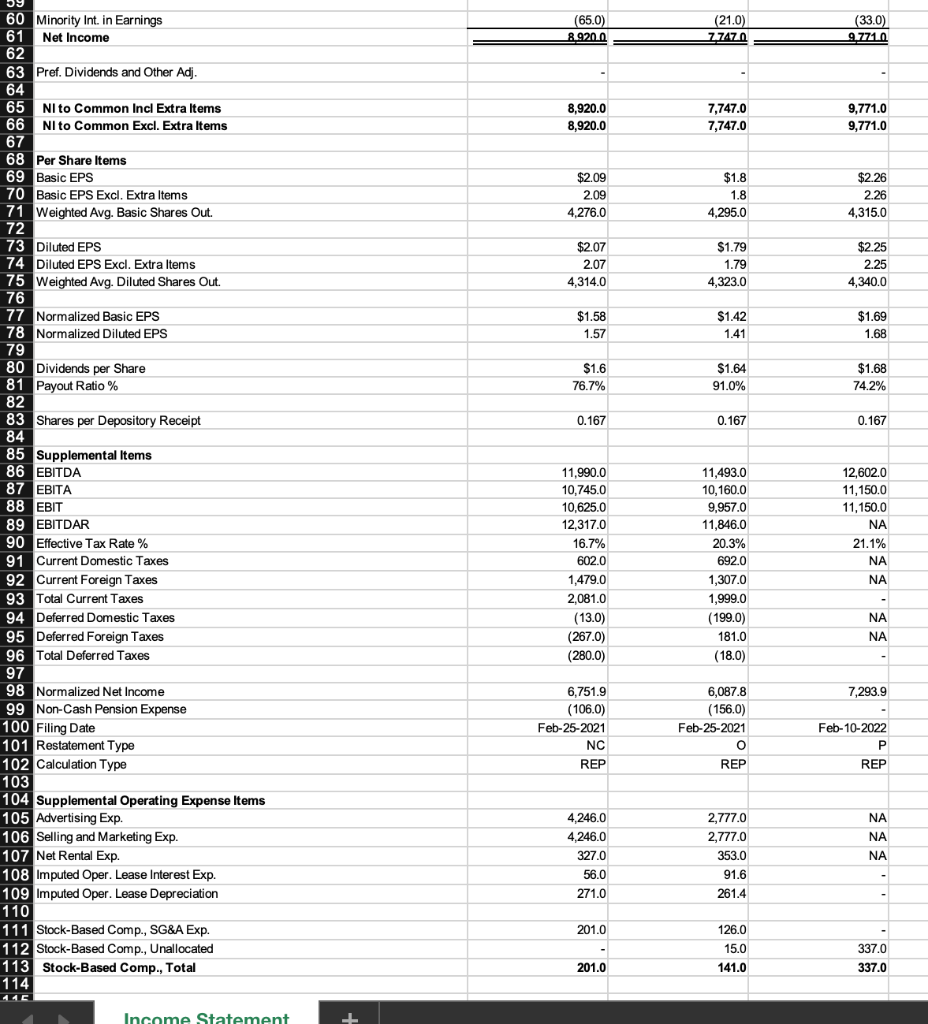
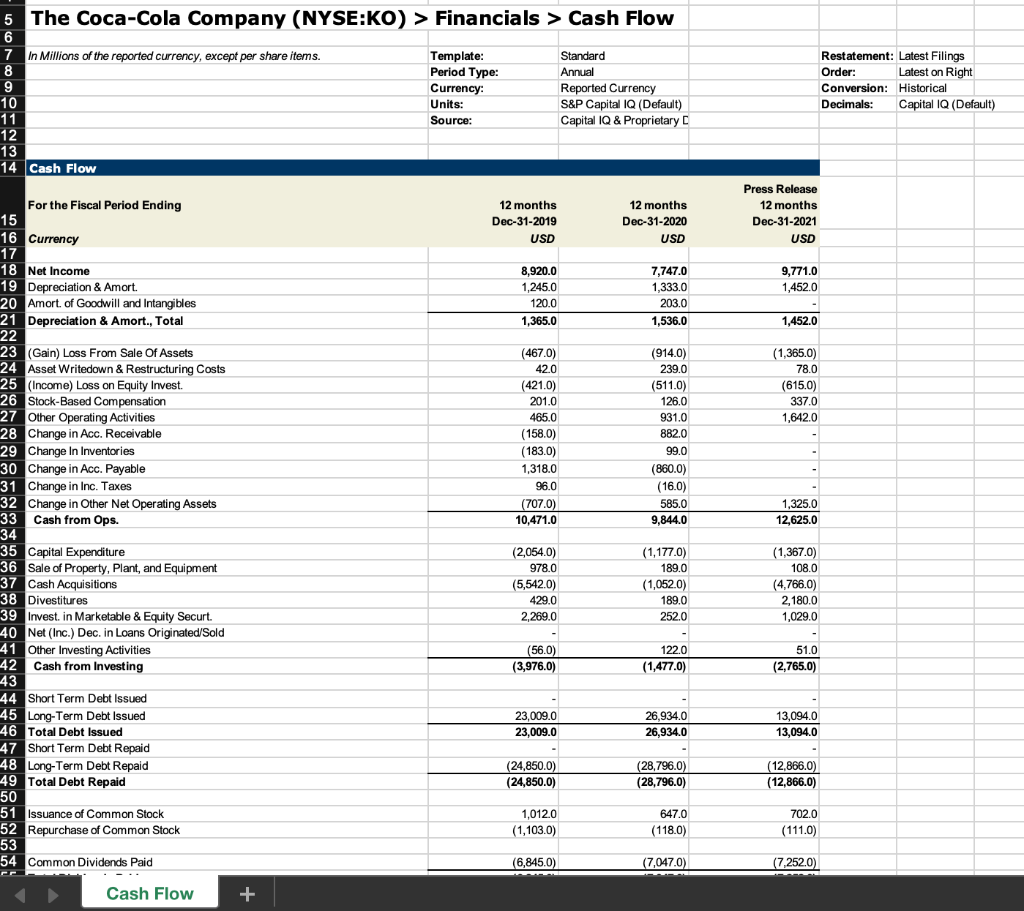
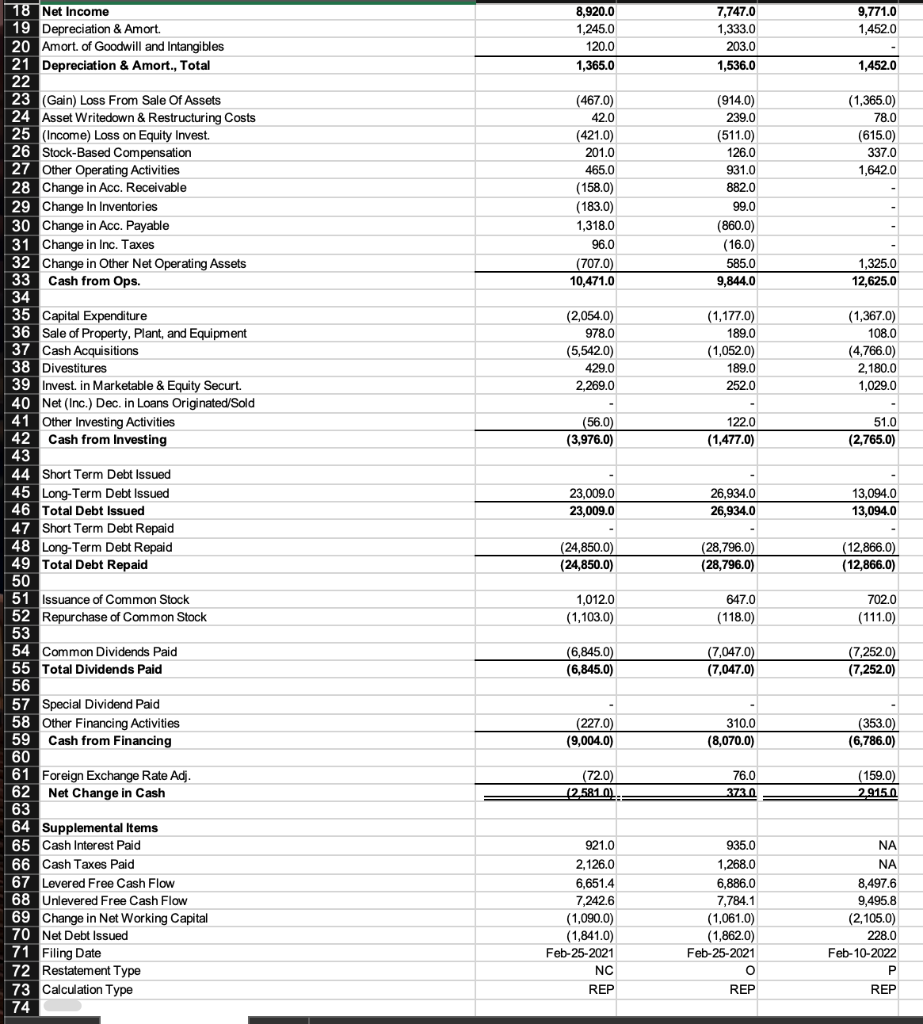
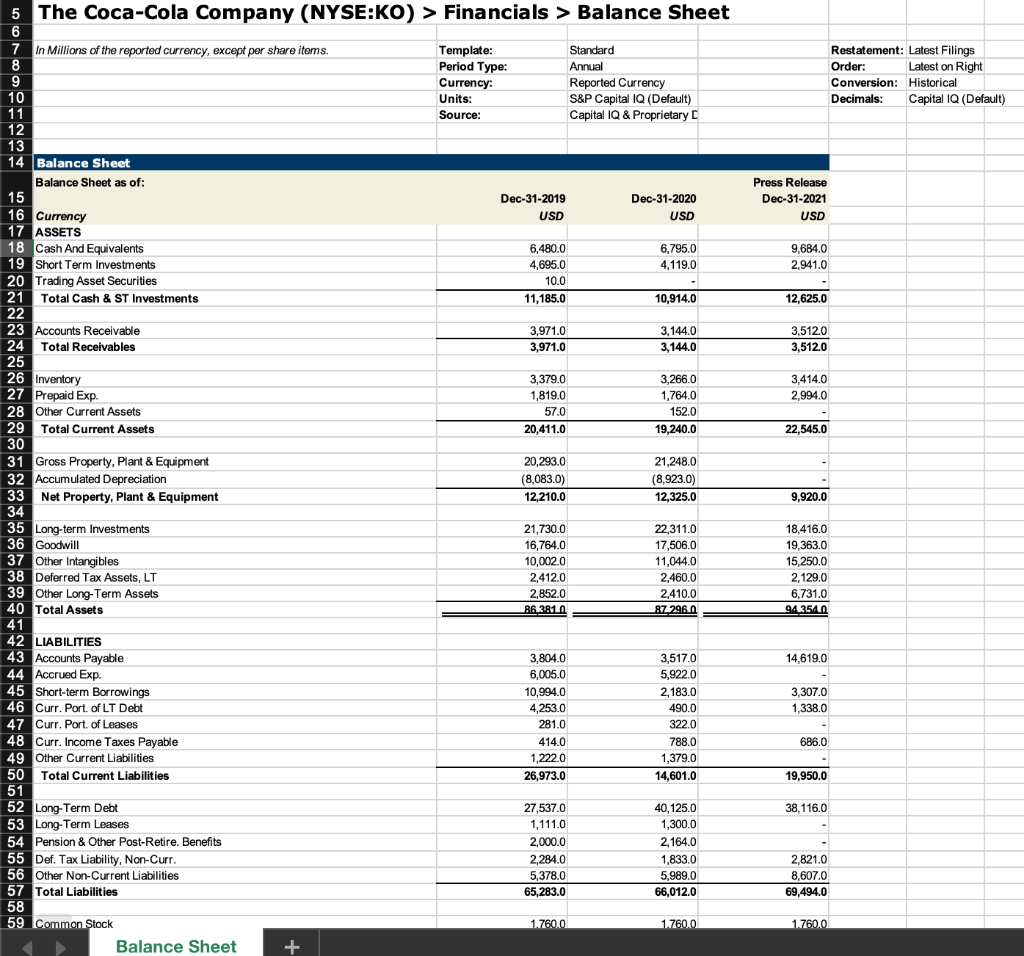
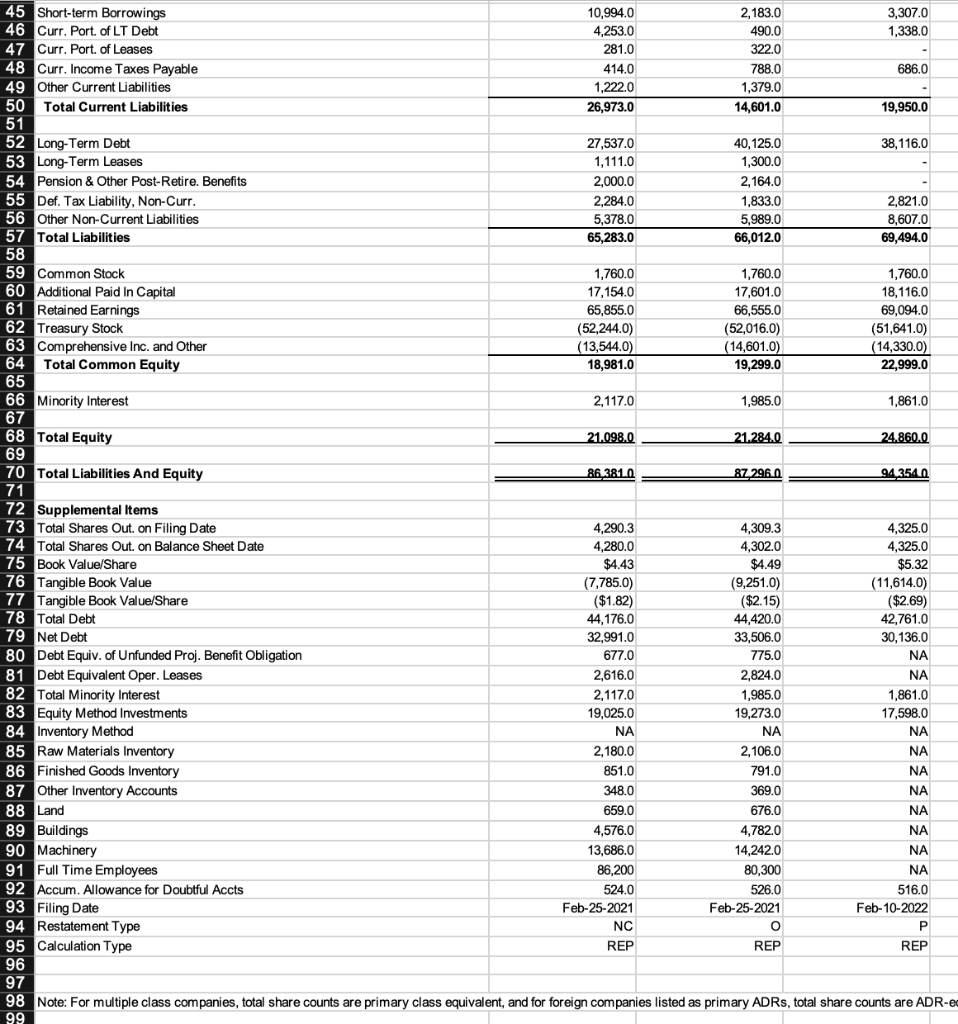
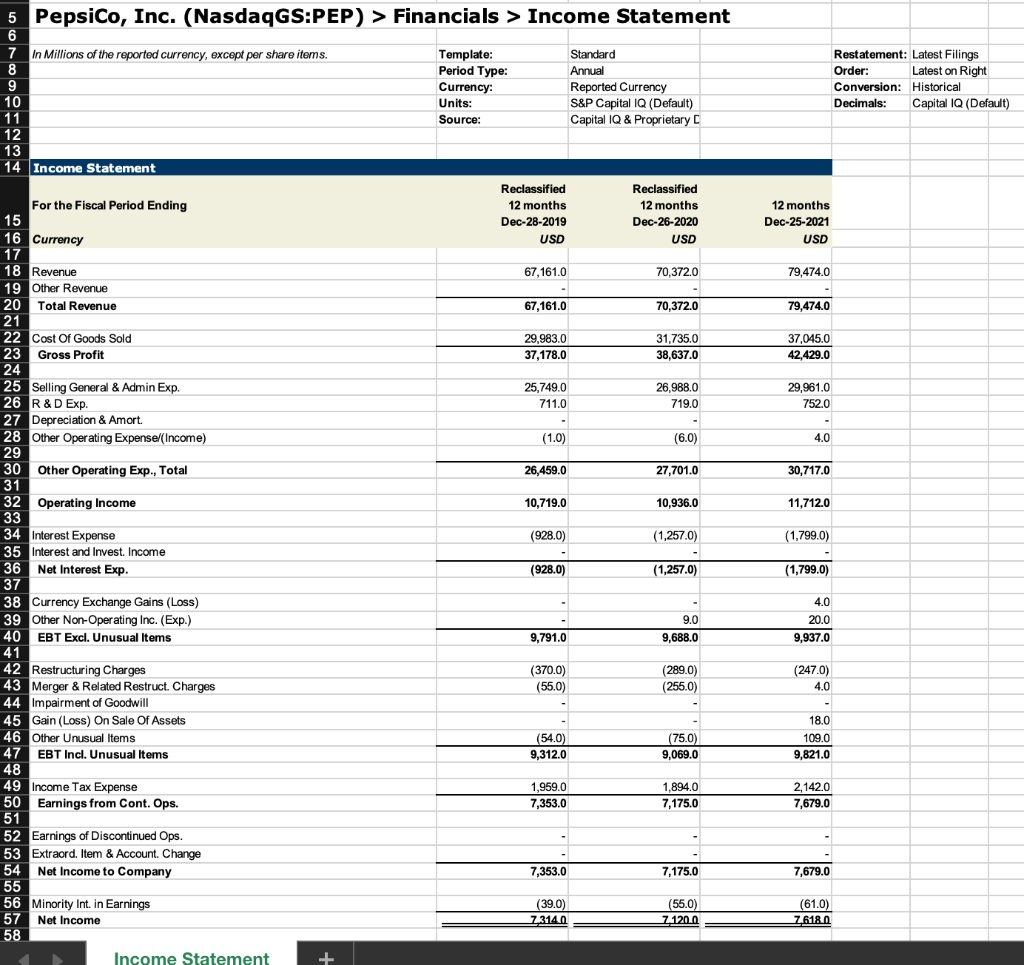
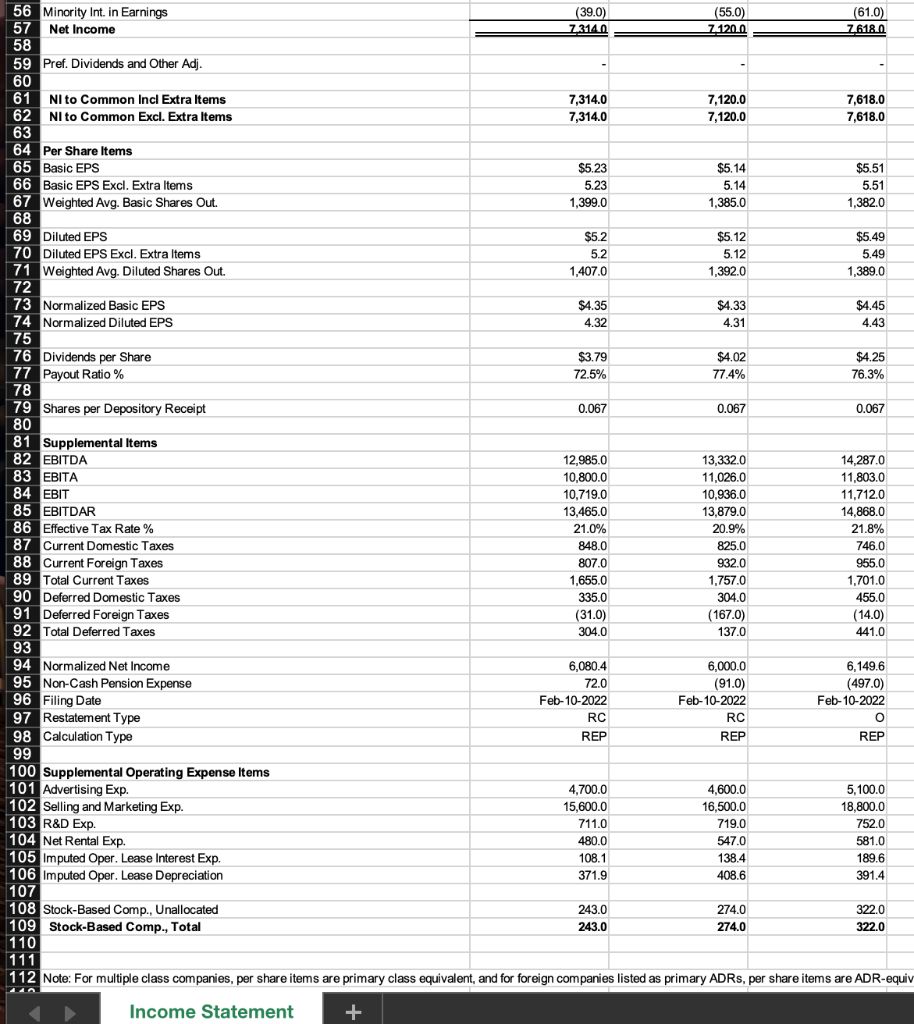
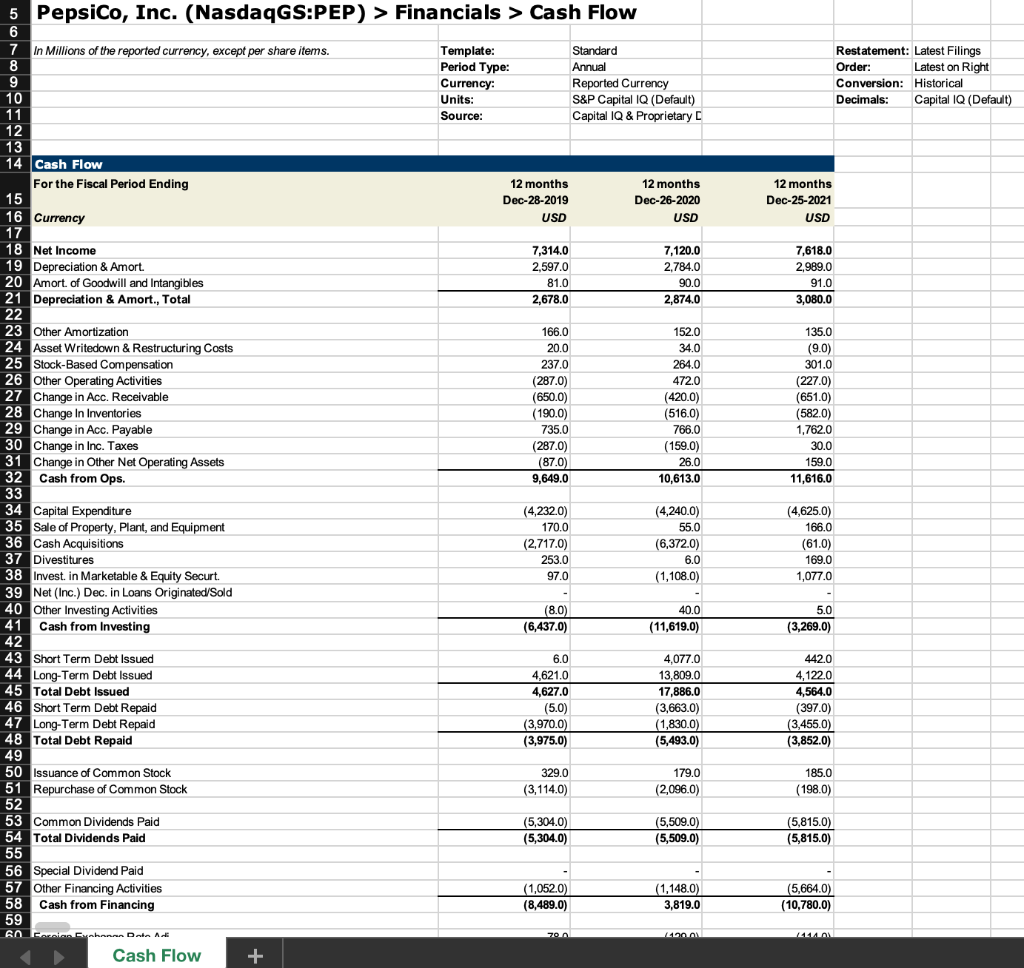
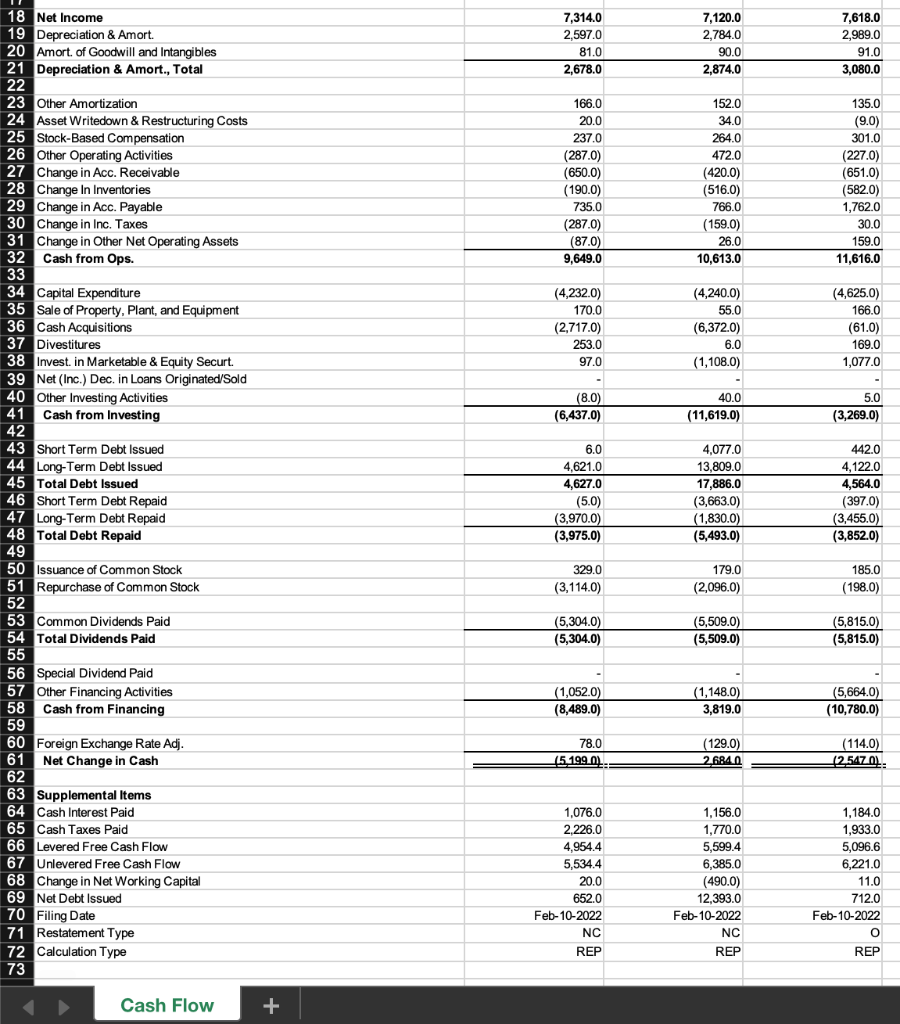
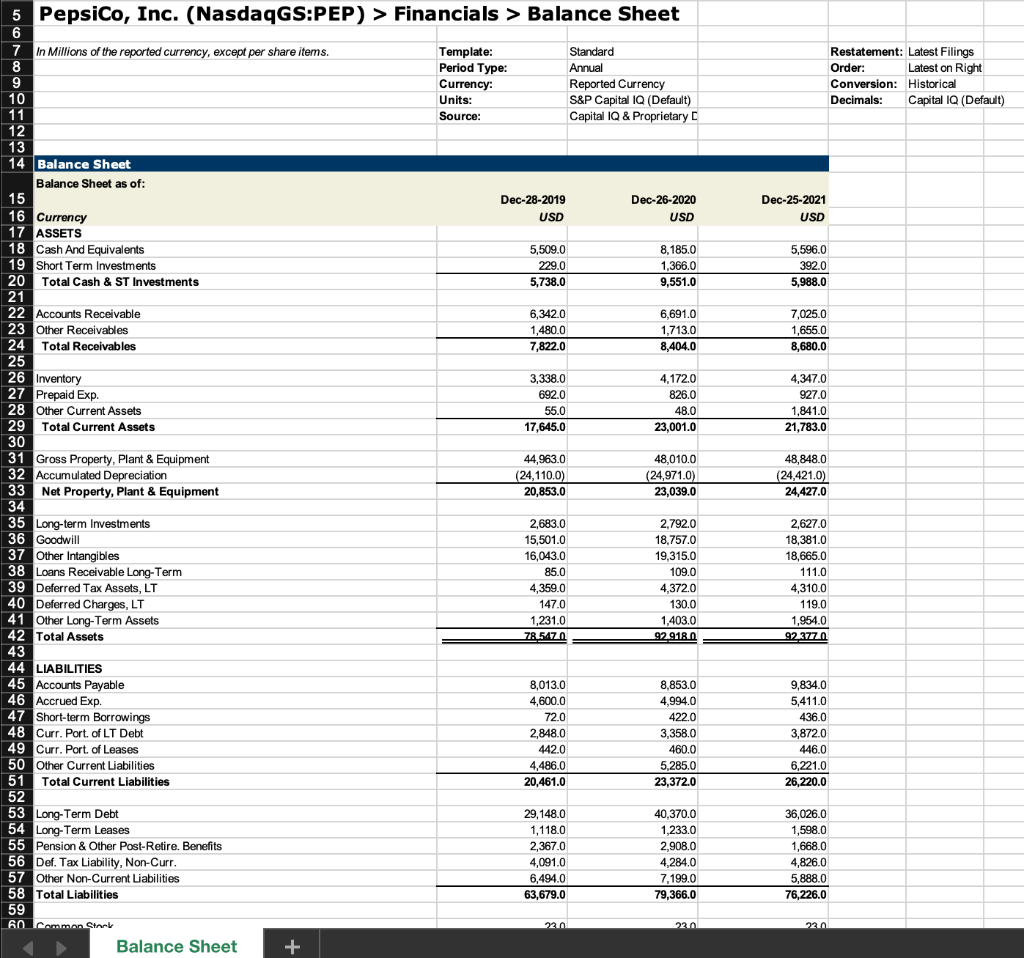
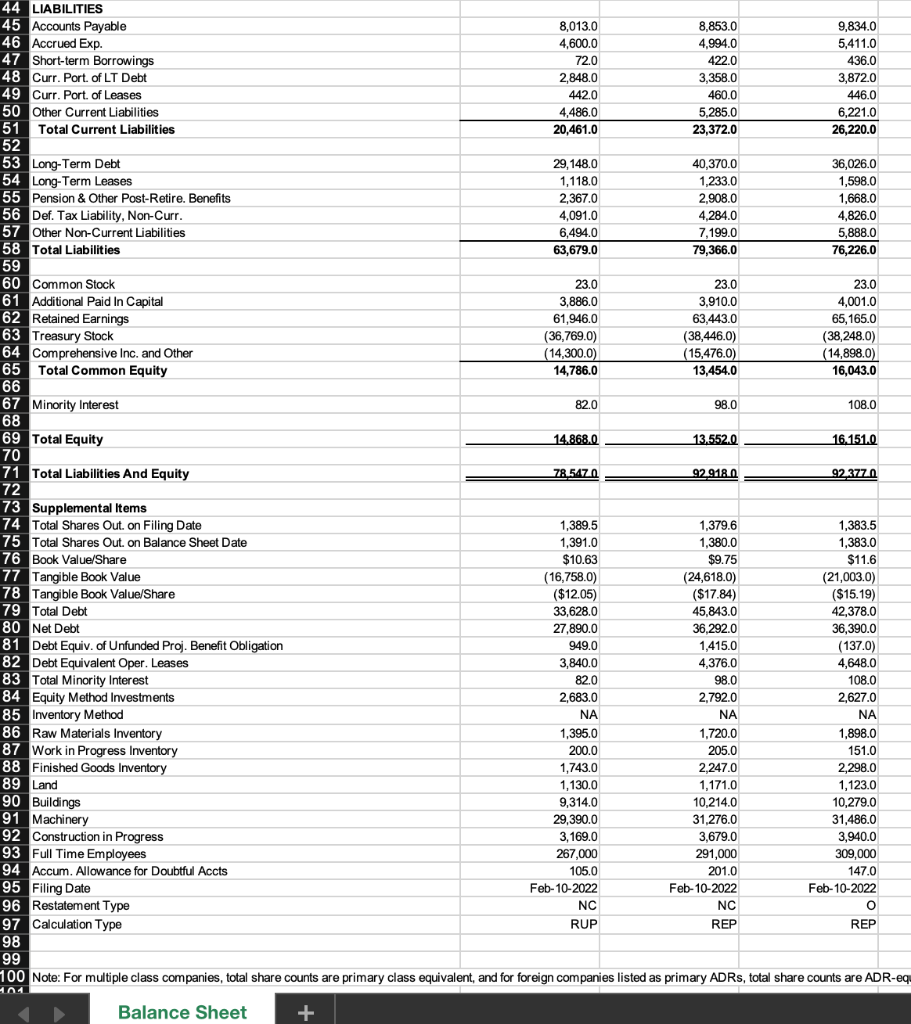
Project To Do List: Overall you will be calculating the ratios in Chapter 4 of the book except for Market Value ratios and analyzing the ratios as instructed below. Convert all the profitability ratios to percentages and round to two decimal places (0.00%) and all other ratios to 3 decimal places (0.123). Use Net Income to Company as Net Income and use a tax rate of 25% for any ratios or calculations requiring a tax rate. A paragraph or two of analysis for each item below will suffice. 1. Coca-Cola Trend Analysis. A. Calculate Coca-cola's liquidity ratios (2 ratios) for each of the last 3 years and access how Coca-cola's liquidity position has changed over time. B. Calculate Coca-cola's asset management ratios (4 ratios) for each of the last 3 years and access how Coca-cola's asset management position has changed over time. C. Calculate Coca-cola's debt management ratios (3 ratios including the liabilites to assets ratio) for each of the last 3 years and access how Coca-cola's debt management position has changed over time. D. Calculate Coca-cola's profitability ratios for each of the last 3 years and access how Coca-cola's profitability position has changed over time. E. What is Coca-cola's biggest strength and weakness based on this trend analysis. 2. Pepsi Trend Analysis. A. Calculate Pepsi's liquidity ratios (2 ratios) for each of the last 3 years and access how Pepsi's liquidity position has changed over time. B. Calculate Pepsi's asset management ratios (4 ratios) for each of the last 3 years and access how Pepsi's asset management position has changed over time. C. Calculate Pepsi's debt management ratios (3 ratios including the liabilites to assets ratio) for each of the last 3 years and access how Pepsi's debt management position has changed over time. D. Calculate Pepsi's profitability ratios for each of the last 3 years and access how Pepsi's profitability position has changed over time. E. What is Pepsi's biggest strength and weakness based on this trend analysis. 3. Comparison Analysis. Compare and contrast each financial ratio of Coca-Cola and Pepsi, or vice versa. Which company do you think is managing each ratio better and each group of ratios better (liquidity, asset management, debt, and profitability)? Explain why. 4. DuPont Analysis. Break down each company's Return on Equity, ROE, into the 3-part DuPont Equation for each year. Comment on what factors caused changes in each company's ROE over the time period. Also, comment on what factors caused differences in Coca-cola's and Pepsi's ROEs over this 3-year period. 5. Free Cash Flow Calculation. Calculate each company's Free Cash Flow for each of the last 2 fiscal years (2020 & 2021). Use a tax rate of 25% and use the depreciation and amortization from the Cash Flow statement. Please do not use any other data from the Cash Flow statement, calculate changes in the relevant balance sheet accounts from year to year (for example: total current assets, gross property plant & equipment, accounts payable & accrued expenses). 5 The Coca-Cola Company (NYSE:KO) > Financials > Income Statement 6 7 In Millions of the reported currency, except per share items. Template: Standard Restatement: Latest Filings 8 Period Type: Annual Order: Latest on Right 9 Currency: Reported Currency Conversion: Historical 10 Units: S&P Capital IQ (Default) Decimals: Capital IQ (Default) 11 Source: Capital IQ & Proprietary D 12 13 14 Income Statement Press Release For the Fiscal Period Ending 12 months 12 months 12 months 15 Dec-31-2019 Dec-31-2020 Dec-31-2021 16 Currency USD USD USD 17 18 Revenue 37,266.0 33,014.0 38,655.0 19 Other Revenue 20 Total Revenue 20 37,266.0 33,014.0 38,655.0 21 21 22 Cost Of Goods Sold 14,619.0 13,433.0 15,357.0 23 Gross Profit 22,647.0 19,581.0 23,298.0 24 25 Selling General & Admin Exp. 12,011.0 9,579.0 12,144.0 26 R&D Exp. 27 Depreciation & Amort. 28 Other Operating Expensel(Income) 11.0 45.0 4.0 29 29 30 Other Operating Exp., Total 12,022.0 9,624.0 12,148.0 31 32 Operating Income 10,625.0 9,957.0 11,150.0 33 34 Interest Expense (946.0) (1,437.0) (1,597.0) 35 Interest and Invest. Income 625.0 442.0 276.0 36 Net Interest Exp. (321.0) (995.0) (1,321.0) 37 20 38 Income (Loss) from Affiliates 1,049.0 978.0 a 1,438.0 39 Currency Exchange Gains (Loss) 20 (120.0) (64.0) 40 Other Non-Operating Inc. (Exp.) (326.0) (102.0) 456.0 41 EBT Excl. Unusual Items 10,907.0 20 9,774.0 11,723.0 42 43 Restructuring Charges (264.0) (567.0) (378.0) 44 Merger & Related Restruct. Charges (46.0) 45 Impairment of Goodwill (14.0) 46 Gain (Loss) On Sale Of Invest. (117.0) 831.0 LOSS 1,661.0 47 Gain (Loss) On Sale Of Assets 829,0 48 Asset Writedown (202.0) (215.0) (78.0) 49 Legal Settlements (15.0) 50 Other Unusual Items (321.0) (60.0) (488.0) 51 EBT Incl. Unusual Items 10,786.0 9.749.0 12,425.0 52 53 Income Tax Expense 1,801.0 1,981.0 2,621.0 54 Earnings from Cont. Ops. 8,985.0 7,768.0 9,804.0 55 56 Earnings of Discontinued Ops. 57 Extraord. Item & Account Change 58 Net Income to Company 8,985.0 7,768.0 9,804.0 0 (65.0) 8.920,0 (21.0) 7.7470 (33.0) 9.771.0 60 Minority Int. in Earnings 61 Net Income 62 63 Pref. Dividends and Other Adj. 64 65 NI to Common Incl Extra Items 66 NI to Common Excl. Extra Items 67 68 Per Share Items 69 Basic EPS 70 Basic EPS Excl. Extra Items 71 Weighted Avg. Basic Shares Out. 8,920.0 8,920.0 7,747.0 7,747.0 9,771.0 9,771.0 $2.09 2.09 4,276.0 $1.8 1.8 4,295.0 $2.26 2.26 4,315.0 72 $2.07 2.07 4,314.0 $1.79 1.79 4.323.0 $2.25 2.25 4,340.0 $1.58 1.57 $1.42 1.41 $1.69 1.68 $1.6 76.7% $1.64 91.0% $1.68 74.2% 0.167 0.167 0.167 73 Diluted EPS 74 Diluted EPS Excl. Extra Items 75 Weighted Avg. Diluted Shares Out. 76 77 Normalized Basic EPS 78 Normalized Diluted EPS 79 80 Dividends per Share 81 Payout Ratio % 82 83 Shares per Depository Receipt 84 85 Supplemental Items 86 EBITDA 87 EBITA 88 EBIT 89 EBITDAR 90 Effective Tax Rate % 91 Current Domestic Taxes 92 Current Foreign Taxes 93 Total Current Taxes 94 Deferred Domestic Taxes 95 Deferred Foreign Taxes 96 Total Deferred Taxes 97 98 Normalized Net Income 99 Non-Cash Pension Expense 100 Filing Date 101 Restatement Type 102 Calculation Type 103 104 Supplemental Operating Expense Items 105 Advertising Exp. 106 Selling and Marketing Exp. 107 Net Rental Exp. 108 Imputed Oper. Lease Interest Exp. 109 Imputed Oper. Lease Depreciation 110 111 Stock-Based Comp., SG&A Exp. 112 Stock-Based Comp., Unallocated 113 Stock-Based Comp., Total 114 11,990.0 10.745.0 10.625.0 12,317.0 16.7% 602.0 1,479.0 2,081.0 (13.0) (267.0) (280.0) 11,493.0 10,160.0 9.957.0 11,846.0 20.3% 692.0 1,307.0 1,999.0 (199.0) 181.0 (18.0) 12,602.0 11,150.0 11,150.0 NA 21.1% NA NA NA NA - 7,293.9 6,751.9 (106.0) Feb-25-2021 NC REP 6,087.8 (156.0) Feb-25-2021 0 REP Feb-10-2022 P REP NA NA 4,246.0 4,246.0 327.0 56.0 271.0 2,777.0 2,777.0 353.0 91.6 261.4 NA 201.0 126.0 15.0 141.0 337.0 337.0 201.0 40 Income Statement 5 The Coca-Cola Company (NYSE:KO) > Financials > Cash Flow 6 7 in Millions of the reported currency, except per share items. Template: Standard 8 Period Type: Annual 9 Currency: Reported Currency 10 Units: S&P Capital IQ (Default) 11 Source: Capital IQ & Proprietary 12 13 14 Cash Flow Restatement: Latest Filings Order: Latest on Right Conversion: Historical Decimals: Capital IQ (Default) 12 months Dec-31-2019 USD 12 months Dec-31-2020 USD Press Release 12 months Dec-31-2021 USD 9,771.0 1,452.0 8.920,0 1,245.0 120.0 1,365.0 7,747.0 1,333.0 203.0 1,536.0 1,452.0 (1,365.0) 78.0 (615.0) 337.0 1,642.0 For the Fiscal Period Ending 15 16 Currency 17 18 Net Income 19 Depreciation & Amort. 20 Amort of Goodwill and Intangibles 21 Depreciation & Amort., Total 22 23 (Gain) Loss From Sale Of Assets 24 Asset Writedown & Restructuring Costs 25 (Income) Loss on Equity Invest. 26 Stock-Based Compensation 27 Other Operating Activities 28 Change in Acc. Receivable 29 Change In Inventories 30 Change in Acc. Payable 31 Change in Inc. Taxes 32 Change in Other Net Operating Assets 33 Cash from Ops. 24 34 35 Capital Expenditure se 36 Sale of Property, Plant, and Equipment 37 Cash Acquisitions 38 Divestitures 39 Invest. in Marketable & Equity Securt. . 40 Net (Inc.) Dec. in Loans Originated/Sold 41 Other Investing Activities 10 42 Cash from Investing (467.0) 42.0 (421.0) 201.0 465.0 (158.0) (183.0) 1,318.0 96.0 (707.0) 10,471.0 (914.0) 239.0 (511.0) 126.0 931.0 882.0 99.0 (860.0) (16.0) 585.0 9.844.0 1,325.0 12,625.0 (2,054.0) 978.0 (5,542.0) 429.0 2.269.0 (1,177.0) 189.0 (1,052.0) 189,0 252.0 (1,367.0) 108.0 (4,766.0) 2,180.0 1,029.0 (56.0) (3,976.0) 122.0 (1,477.0) 51.0 (2,765.0) 43 23,009.0 23,009.0 26,934.0 26,934.0 13,094.0 13,094.0 44 Short Term Debt Issued 45 Long-Term Debt Issued 46 Total Debt Issued 47 Short Term Debt Repaid 48 Long-Term Debt Repaid 49 Total Debt Repaid 50 51 Issuance of Common Stock 52 Repurchase of Common Stock 53 54 Common Dividends Paid (24,850.0) (24,850.0) (28,796.0) (28,796.0) (12,866.0) (12,866.0) 1,012.0 (1,103.0) 647.0 (118.0) 702.0 (111.0) (6,845.0) (7,047.0) (7,252.0) Cash Flow + 9,771.0 1,452.0 8,920.0 1,245.0 120.0 1,365.0 7,747.0 1,333,0 203.0 1,536.0 1,452.0 (1,365.0) 78.0 (615.0) 337.0 1,6420 (467.0) 42.0 (421.0) 201.0 465.0 (158.0) (183.0) 1,318.0 96.0 (707.0) 10,471.0 (914.0) 239.0 (511.0) 126.0 931.0 882.0 99.0 (860.0) (16.0) 585.0 9,844.0 1,325.0 12,625.0 (2,054.0) 978.0 (5,542.0) 429.0 2,269.0 (1,177.0) 189.0 (1,052.0) 189.0 252.0 (1,367.0) 108.0 (4,766.0) 2,180.0 1,029.0 (56.0) (3,976.0) - 122.0 (1,477.0) 51.0 (2,765.0) 18 Net Income 19 Depreciation & Amort. 20 Amort. of Goodwill and Intangibles 21 Depreciation & Amort., Total 22 23 (Gain) Loss From Sale Of Assets 24 Asset Writedown & Restructuring Costs 25 (Income) Loss on Equity Invest. 26 Stock-Based Compensation 27 Other Operating Activities 28 Change in Acc. Receivable 29 Change In Inventories 30 Change in Acc. Payable 31 Change in Inc. Taxes 32 Change in Other Net Operating Assets 33 Cash from Ops. 34 35 Capital Expenditure 36 Sale of Property, Plant, and Equipment 37 Cash Acquisitions 38 Divestitures 39 Invest. in Marketable & Equity Securt. 40 Net (Inc.) Dec. in Loans Originated/Sold 41 Other Investing Activities 42 Cash from Investing 43 44 Short Term Debt Issued 45 Long-Term Debt Issued 46 Total Debt Issued 47 Short Term Debt Repaid 48 Long-Term Debt Repaid 49 Total Debt Repaid 50 51 Issuance of Common Stock 52 Repurchase of Common Stock 53 54 Common Dividends Paid 55 Total Dividends Paid 56 57 Special Dividend Paid 58 Other Financing Activities 59 Cash from Financing 60 61 Foreign Exchange Rate Adj. 62 Net Change in Cash 63 64 Supplemental Items 65 Cash Interest Paid 66 Cash Taxes Paid 67 Levered Free Cash Flow 68 Unlevered Free Cash Flow 69 Change in Net Working Capital 70 Net Debt Issued 71 Filing Date 72 Restatement Type 73 Calculation Type 74 23,009.0 23,009.0 26,934.0 26,934.0 13,094.0 13,094.0 (24,850.0) (24,850.0) (28,796.0) (28,796.0) (12,866.0) (12,866.0) 1,012.0 (1,103.0) 647.0 (118.0) 702.0 (111.0) (6,845.0) (6,845.0) (7,047.0) (7,047.0) (7,252.0) (7,252.0) (227.0) (9,004.0) 310.0 (8,070.0) (353.0) (6,786.0) (72.0) 12.581.0) 76.0 373.0 (159.0) 2.915.0 921.0 2,126.0 6,651.4 7,242.6 (1,090.0) (1,841.0) Feb-25-2021 NC REP 935.0 1,268.0 6,886.0 7,784.1 (1,061.0) (1,862.0) Feb-25-2021 O REP NA NA 8,497.6 9,495.8 (2,105.0) 228.0 Feb-10-2022 REP Restatement: Latest Filings Order: Latest on Right Conversion: Historical Decimals: Capital IQ (Default) Press Release Dec-31-2021 USD 9,684.0 2.941.0 12,625.0 5 The Coca-Cola Company (NYSE:KO) > Financials > Balance Sheet 6 6 7 in Millions of the reported currency, except per share items. Template: Standard 8 Period Type: Annual 9 Currency: Reported Currency 10 Units: S&P Capital IQ (Default) 11 Source: Capital IQ & Proprietary 12 13 14 Balance Sheet Balance Sheet as of: 15 Dec-31-2019 Dec-31-2020 16 Currency USD USD 17 ASSETS 18 Cash And Equivalents 6,480.0 6,795.0 19 Short Term Investments 4,695.0 4.119.0 20 Trading Asset Securities 10.0 21 Total Cash & ST Investments 11,185.0 10,914.0 22 23 Accounts Receivable 3.971.0 3.144.0 24 Total Receivables 3,971.0 3,144.0 25 26 Inventory 3,379.0 3,266.0 27 Prepaid Exp. 1,819.0 1,764.0 28 Other Current Assets 57.0 152.0 29 Total Current Assets 20,411.0 19,240.0 30 31 Gross Property, Plant & Equipment 20,293.0 21,248.0 32 Accumulated Depreciation (8,083.0) (8,923.0) 33 Net Property, Plant & Equipment 12,210.0 12,325.0 34 35 Long-term Investments - 21,730.0 22,311.0 36 Goodwill 16,764.0 17,506.0 37 Other Intangibles 10,002.0 11,044.0 38 Deferred Tax Assets, LT 2,412.0 2,460.0 39 Other Long-Term Assets 2,8520 2,410.0 40 Total Assets 86.3810 87 296.0 3,512.0 3,512.0 3,414.0 2,994.0 22,545.0 9,920.0 18,416.0 19.363.0 15,250.0 2,129.0 6,731.0 943540 41 14,619.0 3,307.0 1,338.0 3,804.0 6,005.0 10,994.0 4.253.0 281.0 414.0 1,222.0 26,973.0 3,517,0 5,922.0 2,183.0 490,0 322.0 788.0 1,379.0 14,601.0 686.0 19,950.0 42 LIABILITIES 43 Accounts Payable 44 Accrued Exp. 45 Short-term Borrowings 46 Curr. Port. of LT Debt 47 Curr. Port of Leases 48 Curr. Income Taxes Payable 49 Other Current Liabilities 50 Total Current Liabilities 51 52 Long-Term Debt 53 Long-Term Leases 54 Pension & Other Post-Retire. Benefits 55 Def. Tax Liability, Non-Curr. 56 Other Non-Current Liabilities 57 Total Liabilities 58 59 Common Stock Balance Sheet 38,116.0 27,537.0 1,111.0 2,000.0 2,284.0 5,378.0 65,283.0 40,125.0 1,300.0 2,164.0 1,833.0 5.989.0 66,012.0 2.821.0 8,607.0 69,494.0 1.760,0 1.760,0 1.760,0 + 1,760.0 45 Short-term Borrowings 10,994.0 2,183.0 3,307.0 46 Curr. Port. of LT Debt 4,253.0 490.0 1,338.0 47 Curr. Port. of Leases 281.0 322.0 48 Curr. Income Taxes Payable 414.0 788.0 686.0 49 Other Current Liabilities 1,222.0 1,379.0 50 Total Current Liabilities 26,973.0 14,601.0 19,950.0 51 52 Long-Term Debt 27,537.0 40,125.0 38, 116.0 53 Long-Term Leases 1,111.0 1,300.0 54 Pension & Other Post-Retire. Benefits 2,000.0 2,164.0 55 Def. Tax Liability, Non-Curr. 2,284.0 1,833.0 2,821.0 56 Other Non-Current Liabilities 5,378.0 5,989.0 8,607.0 57 Total Liabilities 65,283.0 66,012.0 69,494.0 58 59 Common Stock 1,760.0 1,760.0 60 Additional Paid In Capital 17,154.0 17,601.0 18,116.0 61 Retained Earnings 65,855.0 66,555.0 69,094.0 62 Treasury Stock (52,244.0) (52,016.0) (51,641.0) 63 Comprehensive Inc. and Other (13,544.0) (14,601.0) (14,330.0) 64 Total Common Equity 18,981.0 19,299.0 22,999.0 65 66 Minority Interest 2,117.0 1,985.0 1,861.0 67 68 Total Equity 21.098.0 21.284.0 24.860.0 69 70 Total Liabilities And Equity 86.3810 87 296.0 943540 71 72 Supplemental Items 73 Total Shares Outon Filing Date 4,290.3 4,309.3 4,325,0 74 Total Shares Out. on Balance Sheet Date 4,280.0 4,302.0 75 Book Value/Share $4.43 $4.49 76 Tangible Book Value (7,785.0) (9,251.0) (11,614.0) 77 Tangible Book Value/Share ($1.82) ($2.15) ($2.69) 78 Total Debt 44,176.0 44,420.0 42,761.0 79 Net Debt 32,991.0 33,506.0 30,136.0 80 Debt Equiv. of Unfunded Proj. Benefit Obligation 677.0 775.0 NA 81 Debt Equivalent Oper. Leases 2,616.0 2,824.0 NA 82 Total Minority Interest 2,117.0 1,985.0 1,861.0 83 Equity Method Investments 19,025.0 19,273.0 17,598.0 84 Inventory Method NA NA NA 85 Raw Materials Inventory 2,180.0 2,106.0 NA 86 Finished Goods Inventory 851.0 791.0 NA 87 Other Inventory Accounts 348.0 369.0 NA 88 Land 659.0 676.0 NA 89 Buildings 4,576.0 4,782.0 NA 90 Machinery 13,686.0 14,242.0 NA 91 Full Time Employees 86,200 80,300 NA 92 Accum. Allowance for Doubtful Accts 524.0 526,0 516.0 93 Filing Date Feb-25-2021 Feb-25-2021 Feb-10-2022 94 Restatement Type NC O P 95 Calculation Type REP REP 96 97 98 Note: For multiple class companies, total share counts are primary class equivalent, and for foreign companies listed as primary ADRs, total share counts are ADR-e 99 4,325.0 $5.32 REP Restatement: Latest Filings Order: Latest on Right Conversion: Historical Decimals: Capital IQ (Default) 5 PepsiCo, Inc. (Nasdaq GS:PEP) > Financials > Income Statement 6 6 In Millions of the reported currency, except per share items. Template: Standard 8 Period Type: Annual 9 Currency: Reported Currency 10 Units: S&P Capital IQ (Default) 11 Source: Capital IQ & Proprietary C 12 13 14 Income Statement Reclassified Reclassified For the Fiscal Period Ending 12 months 12 months 15 Dec-28-2019 - Dec-26-2020 16 Currency USD USD 17 18 Revenue 67,161.0 70,372.0 19 Other Revenue 20 Total Revenue 67,161.0 70,372.0 21 22 Cost Of Goods Sold 29,983.0 31,735.0 23 Gross Profit 37,178.0 38,637.0 24 25 Selling General & Admin Exp. 25,749.0 26,988.0 26 R & D Exp. & D 711.0 719.0 27 Depreciation & Amort. 28 Other Operating Expensel(Income) (1.0) (6.0) 12 months Dec-25-2021 USD 79,474.0 79,474.0 37,045.0 42,429.0 29,961.0 752.0 4.0 29 26,459.0 27,701.0 30,717.0 10,719.0 10,936.0 11,712.0 (928.0) (1,257.0) (1,799.0) (928.0) (1,257.0) (1,799.0) 40 9.0 20.0 9,937.0 9,791.0 9,688.0 (247.0) (370.0) (55.0) (289.0) (255.0) 4.0 30 Other Operating Exp., Total 31 32 Operating Income 33 34 Interest Expense 35 Interest and Invest. Income 36 Net Interest Exp. 37 38 Currency Exchange Gains (Loss) 39 Other Non-Operating Inc. (Exp.) 40 EBT Excl. Unusual Items 41 42 Restructuring Charges 43 Merger & Related Restruct. Charges 44 Impairment of Goodwill 45 Gain (Loss) On Sale Of Assets 46 Other Unusual Items 47 EBT Incl. Unusual Items 48 49 Income Tax Expense 50 Earnings from Cont. Ops. 51 52 Earnings of Discontinued Ops. 53 Extraord. Item & Account Change 54 Net Income to Company 55 56 Minority Int. in Earnings 57 Net Income 58 Income Statement (54.0) 9,312.0 (75.0) 9,069.0 18.0 109.0 9,821.0 1,959.0 7,353.0 1,894.0 7,175.0 2,142.0 7,679.0 7,353.0 7,175.0 7,679.0 (39.0) 73140 (55.0) 7.120.0 (61.0) 76180 + 12,985.0 56 Minority Int. in Earnings (39.0) (55.0) (61.0) 57 Net Income 7.3140 7.120.0 7.6180 58 59 Pref. Dividends and Other Adj. 60 61 NI to Common Incl Extra Items 7,314.0 7,120.0 7,618.0 62 NI to Common Excl. Extra Items 7,314.0 7,120.0 7,618.0 63 64 Per Share Items 65 Basic EPS $5.23 $5.14 $5.51 66 Basic EPS Excl. Extra Items 5.23 5.14 5.51 67 Weighted Avg. Basic Shares Out. 1,399.0 1,385.0 1,382.0 68 69 Diluted EPS $5.2 $5.12 $5.49 70 Diluted EPS Excl. Extra Items 5.2 5.12 5.49 71 Weighted Avg. Diluted Shares Out. 1,407.0 1,392.0 1,389.0 72 73 Normalized Basic EPS $4.35 $4.33 $4.45 74 Normalized Diluted EPS 4.32 4.31 4.43 75 76 Dividends per Share $3.79 $4.02 $4.25 77 Payout Ratio % 72.5% 77.4% 76.3% 78 79 Shares per Depository Receipt 0.067 0.067 0.067 80 81 Supplemental Items 82 EBITDA 13,332.0 14,287.0 83 EBITA 10,800.0 11,026.0 11,803.0 84 EBIT 10,719.0 10,936.0 11,712.0 85 EBITDAR 13,465.0 13,879.0 14,868.0 86 Effective Tax Rate % 21.0% 20.9% 21.8% 87 Current Domestic Taxes 848.0 825.0 746.0 88 Current Foreign Taxes 8070 932.0 955.0 89 Total Current Taxes 1,655.0 1,757.0 1,701.0 90 Deferred Domestic Taxes 335.0 304.0 455.0 91 Deferred Foreign Taxes (31.0) (167.0) (14.0) 92 Total Deferred Taxes 304.0 137.0 441.0 93 94 Normalized Net Income 6,080.4 6.000.0 6.149.6 95 Non-Cash Pension Expense 72.0 (91.0) (497.0) 96 Filing Date Feb-10-2022 Feb-10-2022 Feb-10-2022 97 Restatement Type RC RC O 98 Calculation Type REP REP 99 100 Supplemental Operating Expense Items 101 Advertising Exp. 4,700.0 4,600.0 5,100.0 102 Selling and Marketing Exp. 15,600.0 16,500.0 18,800.0 103 R&D Exp. 711.0 719.0 752.0 104 Net Rental Exp. 480.0 547.0 581.0 105 Imputed Oper. Lease Interest Exp. 108.1 138.4 189.6 106 Imputed Oper. Lease Depreciation 371.9 408.6 391.4 107 108 Stock-Based Comp., Unallocated 243.0 274.0 322.0 109 Stock-Based Comp., Total 243.0 274.0 322.0 110 111 112 Note: For multiple class companies, per share items are primary class equivalent, and for foreign companies listed as primary ADRs, per share items are ADR-equiv Income Statement + Feb- REP dan Restatement: Latest Filings Order: Latest on Right Conversion: Historical Decimals: Capital IQ (Default) 12 months Dec-25-2021 USD 7,618.0 2,989.0 91.0 3,080.0 5 PepsiCo, Inc. (NasdaqGS:PEP) > Financials > Cash Flow 6 7 In Millions of the reported currency, except per share items. , Template: Standard 8 Period Type: Annual g Currency: Reported Currency 10 Units: S&P Capital IQ (Default) 11 Source: Capital IQ & Proprietary C 12 13 14 Cash Flow For the Fiscal Period Ending 12 months 12 months 15 Dec-28-2019 Dec-26-2020 16 Currency USD USD 17 18 Net Income 7,314.0 7,120.0 19 Depreciation & Amort. 2,597,0 2,784.0 20 Amort. of Goodwill and Intangibles 81.0 90.0 21 Depreciation & Amort., Total 2,678.0 2.874.0 22 23 Other Amortization 166.0 152.0 a 24 Asset Writedown & Restructuring Costs 20.0 34.0 25 Stock-Based Compensation 237.0 264.0 26 Other Operating Activities (287.0) 472.0 27 Change in Acc. Receivable (650.0) (420.0) uang we? 28 Change In Inventories (190.0) (516.0) 29 Change in Acc. Payable 735.0 766.0 30 Change in Inc. Taxes (287.0) (159.0) 31 Change in Other Net Operating Assets (87.0) 26.0 32 Cash from Ops. 9,649.0 10,613.0 33 34 Capital Expenditure (4,232.0) (4,240.0) ( 35 Sale of Property, Plant, and Equipment 170.0 55.0 36 Cash Acquisitions (2.717.0) (6,372.0) 37 Divestitures 253.0 6.0 38 Invest. in Marketable & Equity Securt. 97.0 (1,108.0) 39 Net (Inc.) Dec. in Loans Originated/Sold 40 Other Investing Activities (8.0) 40.0 41 Cash from Investing (6,437.0) (11,619.0) 42 76 43 Short Term Debt Issued 6.0 4,077.0 44 Long-Term Debt Issued 4.621.0 13,809.0 45 Total Debt Issued 4,627.0 17,886.0 46 Short Term Debt Repaid (5.0) (3,663.0) 47 Long-Term Debt Repaid (3,970.0) (1,830.0) 48 Total Debt Repaid (3,975.0) (5,493.0) 49 50 Issuance of Common Stock 329.0 179.0 51 Repurchase of Common Stock (3,114.0) (2,096.0) 52 53 Common Dividends Paid (5,304.0) (5,509.0) 54 Total Dividends Paid (5,304.0) (5,509.0) 55 56 Special Dividend Paid 57 Other Financing Activities (1,052.0) (1,148.0) 58 Cash from Financing (8,489.0) 3,819.0 59 60 Cocina Gynen Date Ad Cash Flow + 135.0 (9.0) 301.0 (227.0) (651.0) ( (582.0) 1,762.0 30.0 159.0 11,616.0 (4,625.0) 166.0 (61.0) 169.0 1,077.0 5.0 (3,269.0) 442.0 4,1220 4,564.0 (397.0) (3,455.0) (3,852.0) 185.0 (1980) (5,815.0) (5,815.0) (5,664.0) (10,780.0) 70 2000 ZALON 7,314.0 2,597.0 81.0 2,678.0 7,120.0 2,784.0 90.0 2,874.0 7,618.0 2,989.0 91.0 3,080.0 166.0 20.0 237.0 (287.0) (650.0) (190.0) 735.0 (287.0) (87.0) 9,649.0 152.0 34.0 264.0 472.0 (420.0) (516.0) 766.0 (159.0) 26.0 10,613.0 135.0 (9.0) 301.0 (227.0) (651.0) (582.0) 1,7620 30.0 159.0 11,616.0 (4,232.0) 170.0 (2,717.0) 253.0 97.0 (4,240.0) 55.0 (6,372.0) 6.0 (1,108.0) (4,625.0) 166.0 (61.0) 169.0 1,077.0 (8.0) (6,437.0) 40.0 (11,619.0) 5.0 (3,269.0) 18 Net Income 19 Depreciation & Amort. 20 Amort of Goodwill and Intangibles 21 Depreciation & Amort., Total 22 23 Other Amortization 24 Asset Writedown & Restructuring Costs 25 Stock-Based Compensation 26 Other Operating Activities 27 Change in Acc. Receivable 28 Change In Inventories 29 Change in Acc. Payable 30 Change in Inc. Taxes 31 Change in Other Net Operating Assets 32 Cash from Ops. 33 34 Capital Expenditure 35 Sale of Property. Plant, and Equipment 36 Cash Acquisitions 37 Divestitures 38 Invest in Marketable & Equity Securt. 39 Net (Inc.) Dec. in Loans Originated/Sold 40 Other Investing Activities 41 Cash from Investing 42 43 Short Term Debt Issued 44 Long-Term Debt Issued 45 Total Debt Issued 46 Short Term Debt Repaid 47 Long-Term Debt Repaid 48 Total Debt Repaid 49 50 Issuance of Common Stock 51 Repurchase of Common Stock 52 53 Common Dividends Paid 54 Total Dividends Paid 55 56 Special Dividend Paid 57 Other Financing Activities 58 Cash from Financing 59 60 Foreign Exchange Rate Adj. 61 Net Change in Cash 62 63 Supplemental Items 64 Cash Interest Paid 65 Cash Taxes Paid 66 Levered Free Cash Flow 67 Unlevered Free Cash Flow 68 Change in Net Working Capital 69 Net Debt Issued 70 Filing Date 71 Restatement Type 72 Calculation Type 73 6.0 4,621.0 4,627.0 (5.0) (3,970.0) (3,975.0) 4,077.0 13,809.0 17,886.0 (3,663.0) (1.830.0) (5,493.0) 442.0 4,122.0 4,564.0 (397.0) (3,455.0) (3,852.0) 329.0 (3,114.0) 179.0 (2,096.0) 185.0 (1980) (5,304.0) (5,304.0) (5,509.0) (5,509.0) (5,815.0) (5,815.0) (1,052.0) (8,489.0) (1,148.0) 3,819.0 (5,664.0) (10,780.0) 78.0 15. 1990) (129.0) 2.6840 (114.0) ( 254701. 1,076.0 2.226.0 4,954.4 5,534.4 20.0 652.0 Feb-10-2022 NC REP 1,156.0 1,770.0 5,599.4 6.385.0 (490.0) 12,393.0 Feb-10-2022 NC 1,184.0 1,933.0 5,096.6 6,221.0 11.0 712.0 Feb-10-2022 O REP REP Cash Flow + + Restatement: Latest Filings Order: Latest on Right Conversion: Historical Decimals: Capital IQ (Default) Dec-25-2021 USD 5,596.0 392.0 5,988.0 9,551.0 7,025.0 1,655.0 8,680.0 8,404.0 4,347.0 927.0 1,841.0 21,783.0 5 PepsiCo, Inc. (NasdaqGS:PEP) > Financials > Balance Sheet 6 In Millions of the reported currency, except per share items. Template: Standard Period Type: Annual 9 Currency: Reported Currency 10 Units: S&P Capital IQ (Default) 11 Source: Capital IQ & Proprietary 12 13 14 Balance Sheet Balance Sheet as of: 15 Dec-28-2019 Dec-26-2020 16 Currency USD USD 17 ASSETS 18 Cash And Equivalents 5,509.0 8,185.0 19 Short Term Investments 229.0 1,366.0 20 Total Cash & ST Investments 5,738.0 21 21 22 Accounts Receivable 6,342.0 6,691.0 23 Other Receivables 1,480.0 1,713.0 24 Total Receivables 24 7,822.0 25 26 Inventory 3,338.0 4,172.0 27 Prepaid Exp. 692.0 826.0 28 Other Current Assets 55.0 48,0 29 Total Current Assets 17,645.0 23,001.0 20 30 31 Gross Property, Plant & Equipment 44,963.0 48,010.0 32 Accumulated Depreciation (24, 110.0) (24.971.0) 33 Net Property, Plant & Equipment 20.853.0 34 - 35 Long-term Investments 15,501.0 18,757.0 37 Other Intangibles 19,315.0 38 Loans Receivable Long-Term 85.0 109,0 0 1024 39 Deferred Tax Assets, LT 4,359.0 40 Deferred Charges, LT 130.0 41 Other Long-Term Assets 1,231.0 1,403.0 42 Total Assets 92.9180 43 40 44 LIABILITIES 45 Accounts Payable 8,013.0 8,853.0 46 Accrued Exp. 4,600.0 4,994.0 47 Short-term Borrowings 47 72.0 48 Curr. Port of LT Debt 2,848.0 3,358.0 49 Curr. Port of Leases 49 Curr. 442.0 50 Other Current Liabilities 50 Other 4,486.0 5,285.0 51 Total Current Liabilities 52 52 53 53 Long-Term Debt 29,148.0 54 Long-Term Leases 54 1,118.0 12230 1,233.0 55 Pension & Other Post-Retire. Benefits 2,367.0 2,908.0 56 Def. Tax Liability, Non-Curr. 4,091.0 4,284.0 57 Other Non-Current Liabilities 6,494.0 7,199.0 58 Total Liabilities 63,679.0 79,366.0 59 60 Common Stark 22.0 22.0 Balance Sheet + 48,848.0 (24,421.0) 24,427.0 23,039.0 2,683.0 2,792.0 36 Goodwill 16,043.0 2,627.0 18,381.0 18,665.0 111.0 4,310.0 119.0 1,954.0 923770 4,3720 147.0 78.5470 9,834.0 5,411.0 436.0 4220 3,872.0 460.0 446.0 6,221.0 20,461.0 23 3720 26,220.0 40,370.0 36,026.0 1,598.0 1,668.0 4,826.0 5,888.0 76,226.0 22.0 44 LIABILITIES 45 Accounts Payable 8,013.0 8,853.0 9,834.0 46 Accrued Exp. 4,600.0 4,994.0 5,411.0 47 Short-term Borrowings 72.0 422.0 436.0 48 Curr. Port of LT Debt 2,848.0 3,358.0 3,872.0 49 Curr. Port. of Leases 442.0 460.0 446.0 50 Other Current Liabilities 4,486.0 5,285.0 6,221.0 51 Total Current Liabilities 20,461.0 23,372.0 26,220.0 52 53 Long-Term Debt 29,148.0 40,370.0 36,026.0 54 Long-Term Leases 1,118.0 1,233.0 1,598.0 55 Pension & Other Post-Retire. Benefits 2,367.0 2,908.0 1,668.0 56 Def. Tax Liability, Non-Curr. 4,091.0 4,284.0 4,826.0 57 Other Non-Current Liabilities 6,494.0 7,199.0 5,888.0 58 Total Liabilities 63,679.0 79,366.0 76,226.0 59 60 Common Stock 23.0 23.0 23.0 61 Additional Paid In Capital 3,886.0 3,910.0 4,001.0 62 Retained Earnings 61,946.0 63.443.0 65,165.0 63 Treasury Stock (36,769.0) (38,446.0) (38,248.0) 64 Comprehensive Inc. and Other (14,300.0) (15.476.0) (14,898.0) 65 Total Common Equity 14,786.0 13.454.0 16,043.0 66 67 Minority Interest 82.0 98.0 108.0 68 69 Total Equity 14.868.0 13.5520 16.151.0 70 71 Total Liabilities And Equity 78.5470 92 9180 92.377.0 72 73 Supplemental Items 74 Total Shares Out, on Filing Date 1,389.5 1,379.6 1,383.5 75 Total Shares Out. on Balance Sheet Date 1,391.0 1,380.0 1,383.0 76 Book Value/Share $10.63 $9.75 $11.6 77 Tangible Book Value (16,758.0) (24,618.0) (21,003.0) 78 Tangible Book Value/Share ($12.05) ($17.84) ($15.19) 79 Total Debt 33,628.0 45,843.0 42,378.0 80 Net Debt 27,890.0 36,292.0 36,390.0 81 Debt Equiv. of Unfunded Proj. Benefit Obligation 949.0 (137.0) 82 Debt Equivalent Oper. Leases 3,840.0 4,376.0 4,648.0 83 Total Minority Interest 82.0 98.0 108.0 84 Equity Method Investments 2,683.0 2,792.0 2,627.0 85 Inventory Method NA NA NA 86 Raw Materials Inventory 1,395.0 1,720.0 1,898.0 87 Work in Progress Inventory 200.0 205.0 151.0 88 Finished Goods Inventory 1,743,0 2.247.0 2,298.0 89 Land 1,130.0 1,171.0 1,123.0 90 Buildings 9,314.0 10.214.0 10,279.0 91 Machinery 29,390.0 31,276.0 31,486.0 92 Construction in Progress 3,169.0 3,679.0 3,940.0 93 Full Time Employees 267.000 291,000 309,000 94 Accum. Allowance for Doubtful Accts 105.0 201.0 147.0 95 Filing Date Feb-10-2022 Feb-10-2022 Feb-10-2022 96 Restatement Type NC NC O 97 Calculation Type RUP REP REP 98 99 100 Note: For multiple class companies, total share counts are primary class equivalent, and for foreign companies listed as primary ADRs, total share counts are ADR-eq 101 Balance Sheet + 1,415,0 Project To Do List: Overall you will be calculating the ratios in Chapter 4 of the book except for Market Value ratios and analyzing the ratios as instructed below. Convert all the profitability ratios to percentages and round to two decimal places (0.00%) and all other ratios to 3 decimal places (0.123). Use Net Income to Company as Net Income and use a tax rate of 25% for any ratios or calculations requiring a tax rate. A paragraph or two of analysis for each item below will suffice. 1. Coca-Cola Trend Analysis. A. Calculate Coca-cola's liquidity ratios (2 ratios) for each of the last 3 years and access how Coca-cola's liquidity position has changed over time. B. Calculate Coca-cola's asset management ratios (4 ratios) for each of the last 3 years and access how Coca-cola's asset management position has changed over time. C. Calculate Coca-cola's debt management ratios (3 ratios including the liabilites to assets ratio) for each of the last 3 years and access how Coca-cola's debt management position has changed over time. D. Calculate Coca-cola's profitability ratios for each of the last 3 years and access how Coca-cola's profitability position has changed over time. E. What is Coca-cola's biggest strength and weakness based on this trend analysis. 2. Pepsi Trend Analysis. A. Calculate Pepsi's liquidity ratios (2 ratios) for each of the last 3 years and access how Pepsi's liquidity position has changed over time. B. Calculate Pepsi's asset management ratios (4 ratios) for each of the last 3 years and access how Pepsi's asset management position has changed over time. C. Calculate Pepsi's debt management ratios (3 ratios including the liabilites to assets ratio) for each of the last 3 years and access how Pepsi's debt management position has changed over time. D. Calculate Pepsi's profitability ratios for each of the last 3 years and access how Pepsi's profitability position has changed over time. E. What is Pepsi's biggest strength and weakness based on this trend analysis. 3. Comparison Analysis. Compare and contrast each financial ratio of Coca-Cola and Pepsi, or vice versa. Which company do you think is managing each ratio better and each group of ratios better (liquidity, asset management, debt, and profitability)? Explain why. 4. DuPont Analysis. Break down each company's Return on Equity, ROE, into the 3-part DuPont Equation for each year. Comment on what factors caused changes in each company's ROE over the time period. Also, comment on what factors caused differences in Coca-cola's and Pepsi's ROEs over this 3-year period. 5. Free Cash Flow Calculation. Calculate each company's Free Cash Flow for each of the last 2 fiscal years (2020 & 2021). Use a tax rate of 25% and use the depreciation and amortization from the Cash Flow statement. Please do not use any other data from the Cash Flow statement, calculate changes in the relevant balance sheet accounts from year to year (for example: total current assets, gross property plant & equipment, accounts payable & accrued expenses). 5 The Coca-Cola Company (NYSE:KO) > Financials > Income Statement 6 7 In Millions of the reported currency, except per share items. Template: Standard Restatement: Latest Filings 8 Period Type: Annual Order: Latest on Right 9 Currency: Reported Currency Conversion: Historical 10 Units: S&P Capital IQ (Default) Decimals: Capital IQ (Default) 11 Source: Capital IQ & Proprietary D 12 13 14 Income Statement Press Release For the Fiscal Period Ending 12 months 12 months 12 months 15 Dec-31-2019 Dec-31-2020 Dec-31-2021 16 Currency USD USD USD 17 18 Revenue 37,266.0 33,014.0 38,655.0 19 Other Revenue 20 Total Revenue 20 37,266.0 33,014.0 38,655.0 21 21 22 Cost Of Goods Sold 14,619.0 13,433.0 15,357.0 23 Gross Profit 22,647.0 19,581.0 23,298.0 24 25 Selling General & Admin Exp. 12,011.0 9,579.0 12,144.0 26 R&D Exp. 27 Depreciation & Amort. 28 Other Operating Expensel(Income) 11.0 45.0 4.0 29 29 30 Other Operating Exp., Total 12,022.0 9,624.0 12,148.0 31 32 Operating Income 10,625.0 9,957.0 11,150.0 33 34 Interest Expense (946.0) (1,437.0) (1,597.0) 35 Interest and Invest. Income 625.0 442.0 276.0 36 Net Interest Exp. (321.0) (995.0) (1,321.0) 37 20 38 Income (Loss) from Affiliates 1,049.0 978.0 a 1,438.0 39 Currency Exchange Gains (Loss) 20 (120.0) (64.0) 40 Other Non-Operating Inc. (Exp.) (326.0) (102.0) 456.0 41 EBT Excl. Unusual Items 10,907.0 20 9,774.0 11,723.0 42 43 Restructuring Charges (264.0) (567.0) (378.0) 44 Merger & Related Restruct. Charges (46.0) 45 Impairment of Goodwill (14.0) 46 Gain (Loss) On Sale Of Invest. (117.0) 831.0 LOSS 1,661.0 47 Gain (Loss) On Sale Of Assets 829,0 48 Asset Writedown (202.0) (215.0) (78.0) 49 Legal Settlements (15.0) 50 Other Unusual Items (321.0) (60.0) (488.0) 51 EBT Incl. Unusual Items 10,786.0 9.749.0 12,425.0 52 53 Income Tax Expense 1,801.0 1,981.0 2,621.0 54 Earnings from Cont. Ops. 8,985.0 7,768.0 9,804.0 55 56 Earnings of Discontinued Ops. 57 Extraord. Item & Account Change 58 Net Income to Company 8,985.0 7,768.0 9,804.0 0 (65.0) 8.920,0 (21.0) 7.7470 (33.0) 9.771.0 60 Minority Int. in Earnings 61 Net Income 62 63 Pref. Dividends and Other Adj. 64 65 NI to Common Incl Extra Items 66 NI to Common Excl. Extra Items 67 68 Per Share Items 69 Basic EPS 70 Basic EPS Excl. Extra Items 71 Weighted Avg. Basic Shares Out. 8,920.0 8,920.0 7,747.0 7,747.0 9,771.0 9,771.0 $2.09 2.09 4,276.0 $1.8 1.8 4,295.0 $2.26 2.26 4,315.0 72 $2.07 2.07 4,314.0 $1.79 1.79 4.323.0 $2.25 2.25 4,340.0 $1.58 1.57 $1.42 1.41 $1.69 1.68 $1.6 76.7% $1.64 91.0% $1.68 74.2% 0.167 0.167 0.167 73 Diluted EPS 74 Diluted EPS Excl. Extra Items 75 Weighted Avg. Diluted Shares Out. 76 77 Normalized Basic EPS 78 Normalized Diluted EPS 79 80 Dividends per Share 81 Payout Ratio % 82 83 Shares per Depository Receipt 84 85 Supplemental Items 86 EBITDA 87 EBITA 88 EBIT 89 EBITDAR 90 Effective Tax Rate % 91 Current Domestic Taxes 92 Current Foreign Taxes 93 Total Current Taxes 94 Deferred Domestic Taxes 95 Deferred Foreign Taxes 96 Total Deferred Taxes 97 98 Normalized Net Income 99 Non-Cash Pension Expense 100 Filing Date 101 Restatement Type 102 Calculation Type 103 104 Supplemental Operating Expense Items 105 Advertising Exp. 106 Selling and Marketing Exp. 107 Net Rental Exp. 108 Imputed Oper. Lease Interest Exp. 109 Imputed Oper. Lease Depreciation 110 111 Stock-Based Comp., SG&A Exp. 112 Stock-Based Comp., Unallocated 113 Stock-Based Comp., Total 114 11,990.0 10.745.0 10.625.0 12,317.0 16.7% 602.0 1,479.0 2,081.0 (13.0) (267.0) (280.0) 11,493.0 10,160.0 9.957.0 11,846.0 20.3% 692.0 1,307.0 1,999.0 (199.0) 181.0 (18.0) 12,602.0 11,150.0 11,150.0 NA 21.1% NA NA NA NA - 7,293.9 6,751.9 (106.0) Feb-25-2021 NC REP 6,087.8 (156.0) Feb-25-2021 0 REP Feb-10-2022 P REP NA NA 4,246.0 4,246.0 327.0 56.0 271.0 2,777.0 2,777.0 353.0 91.6 261.4 NA 201.0 126.0 15.0 141.0 337.0 337.0 201.0 40 Income Statement 5 The Coca-Cola Company (NYSE:KO) > Financials > Cash Flow 6 7 in Millions of the reported currency, except per share items. Template: Standard 8 Period Type: Annual 9 Currency: Reported Currency 10 Units: S&P Capital IQ (Default) 11 Source: Capital IQ & Proprietary 12 13 14 Cash Flow Restatement: Latest Filings Order: Latest on Right Conversion: Historical Decimals: Capital IQ (Default) 12 months Dec-31-2019 USD 12 months Dec-31-2020 USD Press Release 12 months Dec-31-2021 USD 9,771.0 1,452.0 8.920,0 1,245.0 120.0 1,365.0 7,747.0 1,333.0 203.0 1,536.0 1,452.0 (1,365.0) 78.0 (615.0) 337.0 1,642.0 For the Fiscal Period Ending 15 16 Currency 17 18 Net Income 19 Depreciation & Amort. 20 Amort of Goodwill and Intangibles 21 Depreciation & Amort., Total 22 23 (Gain) Loss From Sale Of Assets 24 Asset Writedown & Restructuring Costs 25 (Income) Loss on Equity Invest. 26 Stock-Based Compensation 27 Other Operating Activities 28 Change in Acc. Receivable 29 Change In Inventories 30 Change in Acc. Payable 31 Change in Inc. Taxes 32 Change in Other Net Operating Assets 33 Cash from Ops. 24 34 35 Capital Expenditure se 36 Sale of Property, Plant, and Equipment 37 Cash Acquisitions 38 Divestitures 39 Invest. in Marketable & Equity Securt. . 40 Net (Inc.) Dec. in Loans Originated/Sold 41 Other Investing Activities 10 42 Cash from Investing (467.0) 42.0 (421.0) 201.0 465.0 (158.0) (183.0) 1,318.0 96.0 (707.0) 10,471.0 (914.0) 239.0 (511.0) 126.0 931.0 882.0 99.0 (860.0) (16.0) 585.0 9.844.0 1,325.0 12,625.0 (2,054.0) 978.0 (5,542.0) 429.0 2.269.0 (1,177.0) 189.0 (1,052.0) 189,0 252.0 (1,367.0) 108.0 (4,766.0) 2,180.0 1,029.0 (56.0) (3,976.0) 122.0 (1,477.0) 51.0 (2,765.0) 43 23,009.0 23,009.0 26,934.0 26,934.0 13,094.0 13,094.0 44 Short Term Debt Issued 45 Long-Term Debt Issued 46 Total Debt Issued 47 Short Term Debt Repaid 48 Long-Term Debt Repaid 49 Total Debt Repaid 50 51 Issuance of Common Stock 52 Repurchase of Common Stock 53 54 Common Dividends Paid (24,850.0) (24,850.0) (28,796.0) (28,796.0) (12,866.0) (12,866.0) 1,012.0 (1,103.0) 647.0 (118.0) 702.0 (111.0) (6,845.0) (7,047.0) (7,252.0) Cash Flow + 9,771.0 1,452.0 8,920.0 1,245.0 120.0 1,365.0 7,747.0 1,333,0 203.0 1,536.0 1,452.0 (1,365.0) 78.0 (615.0) 337.0 1,6420 (467.0) 42.0 (421.0) 201.0 465.0 (158.0) (183.0) 1,318.0 96.0 (707.0) 10,471.0 (914.0) 239.0 (511.0) 126.0 931.0 882.0 99.0 (860.0) (16.0) 585.0 9,844.0 1,325.0 12,625.0 (2,054.0) 978.0 (5,542.0) 429.0 2,269.0 (1,177.0) 189.0 (1,052.0) 189.0 252.0 (1,367.0) 108.0 (4,766.0) 2,180.0 1,029.0 (56.0) (3,976.0) - 122.0 (1,477.0) 51.0 (2,765.0) 18 Net Income 19 Depreciation & Amort. 20 Amort. of Goodwill and Intangibles 21 Depreciation & Amort., Total 22 23 (Gain) Loss From Sale Of Assets 24 Asset Writedown & Restructuring Costs 25 (Income) Loss on Equity Invest. 26 Stock-Based Compensation 27 Other Operating Activities 28 Change in Acc. Receivable 29 Change In Inventories 30 Change in Acc. Payable 31 Change in Inc. Taxes 32 Change in Other Net Operating Assets 33 Cash from Ops. 34 35 Capital Expenditure 36 Sale of Property, Plant, and Equipment 37 Cash Acquisitions 38 Divestitures 39 Invest. in Marketable & Equity Securt. 40 Net (Inc.) Dec. in Loans Originated/Sold 41 Other Investing Activities 42 Cash from Investing 43 44 Short Term Debt Issued 45 Long-Term Debt Issued 46 Total Debt Issued 47 Short Term Debt Repaid 48 Long-Term Debt Repaid 49 Total Debt Repaid 50 51 Issuance of Common Stock 52 Repurchase of Common Stock 53 54 Common Dividends Paid 55 Total Dividends Paid 56 57 Special Dividend Paid 58 Other Financing Activities 59 Cash from Financing 60 61 Foreign Exchange Rate Adj. 62 Net Change in Cash 63 64 Supplemental Items 65 Cash Interest Paid 66 Cash Taxes Paid 67 Levered Free Cash Flow 68 Unlevered Free Cash Flow 69 Change in Net Working Capital 70 Net Debt Issued 71 Filing Date 72 Restatement Type 73 Calculation Type 74 23,009.0 23,009.0 26,934.0 26,934.0 13,094.0 13,094.0 (24,850.0) (24,850.0) (28,796.0) (28,796.0) (12,866.0) (12,866.0) 1,012.0 (1,103.0) 647.0 (118.0) 702.0 (111.0) (6,845.0) (6,845.0) (7,047.0) (7,047.0) (7,252.0) (7,252.0) (227.0) (9,004.0) 310.0 (8,070.0) (353.0) (6,786.0) (72.0) 12.581.0) 76.0 373.0 (159.0) 2.915.0 921.0 2,126.0 6,651.4 7,242.6 (1,090.0) (1,841.0) Feb-25-2021 NC REP 935.0 1,268.0 6,886.0 7,784.1 (1,061.0) (1,862.0) Feb-25-2021 O REP NA NA 8,497.6 9,495.8 (2,105.0) 228.0 Feb-10-2022 REP Restatement: Latest Filings Order: Latest on Right Conversion: Historical Decimals: Capital IQ (Default) Press Release Dec-31-2021 USD 9,684.0 2.941.0 12,625.0 5 The Coca-Cola Company (NYSE:KO) > Financials > Balance Sheet 6 6 7 in Millions of the reported currency, except per share items. Template: Standard 8 Period Type: Annual 9 Currency: Reported Currency 10 Units: S&P Capital IQ (Default) 11 Source: Capital IQ & Proprietary 12 13 14 Balance Sheet Balance Sheet as of: 15 Dec-31-2019 Dec-31-2020 16 Currency USD USD 17 ASSETS 18 Cash And Equivalents 6,480.0 6,795.0 19 Short Term Investments 4,695.0 4.119.0 20 Trading Asset Securities 10.0 21 Total Cash & ST Investments 11,185.0 10,914.0 22 23 Accounts Receivable 3.971.0 3.144.0 24 Total Receivables 3,971.0 3,144.0 25 26 Inventory 3,379.0 3,266.0 27 Prepaid Exp. 1,819.0 1,764.0 28 Other Current Assets 57.0 152.0 29 Total Current Assets 20,411.0 19,240.0 30 31 Gross Property, Plant & Equipment 20,293.0 21,248.0 32 Accumulated Depreciation (8,083.0) (8,923.0) 33 Net Property, Plant & Equipment 12,210.0 12,325.0 34 35 Long-term Investments - 21,730.0 22,311.0 36 Goodwill 16,764.0 17,506.0 37 Other Intangibles 10,002.0 11,044.0 38 Deferred Tax Assets, LT 2,412.0 2,460.0 39 Other Long-Term Assets 2,8520 2,410.0 40 Total Assets 86.3810 87 296.0 3,512.0 3,512.0 3,414.0 2,994.0 22,545.0 9,920.0 18,416.0 19.363.0 15,250.0 2,129.0 6,731.0 943540 41 14,619.0 3,307.0 1,338.0 3,804.0 6,005.0 10,994.0 4.253.0 281.0 414.0 1,222.0 26,973.0 3,517,0 5,922.0 2,183.0 490,0 322.0 788.0 1,379.0 14,601.0 686.0 19,950.0 42 LIABILITIES 43 Accounts Payable 44 Accrued Exp. 45 Short-term Borrowings 46 Curr. Port. of LT Debt 47 Curr. Port of Leases 48 Curr. Income Taxes Payable 49 Other Current Liabilities 50 Total Current Liabilities 51 52 Long-Term Debt 53 Long-Term Leases 54 Pension & Other Post-Retire. Benefits 55 Def. Tax Liability, Non-Curr. 56 Other Non-Current Liabilities 57 Total Liabilities 58 59 Common Stock Balance Sheet 38,116.0 27,537.0 1,111.0 2,000.0 2,284.0 5,378.0 65,283.0 40,125.0 1,300.0 2,164.0 1,833.0 5.989.0 66,012.0 2.821.0 8,607.0 69,494.0 1.760,0 1.760,0 1.760,0 + 1,760.0 45 Short-term Borrowings 10,994.0 2,183.0 3,307.0 46 Curr. Port. of LT Debt 4,253.0 490.0 1,338.0 47 Curr. Port. of Leases 281.0 322.0 48 Curr. Income Taxes Payable 414.0 788.0 686.0 49 Other Current Liabilities 1,222.0 1,379.0 50 Total Current Liabilities 26,973.0 14,601.0 19,950.0 51 52 Long-Term Debt 27,537.0 40,125.0 38, 116.0 53 Long-Term Leases 1,111.0 1,300.0 54 Pension & Other Post-Retire. Benefits 2,000.0 2,164.0 55 Def. Tax Liability, Non-Curr. 2,284.0 1,833.0 2,821.0 56 Other Non-Current Liabilities 5,378.0 5,989.0 8,607.0 57 Total Liabilities 65,283.0 66,012.0 69,494.0 58 59 Common Stock 1,760.0 1,760.0 60 Additional Paid In Capital 17,154.0 17,601.0 18,116.0 61 Retained Earnings 65,855.0 66,555.0 69,094.0 62 Treasury Stock (52,244.0) (52,016.0) (51,641.0) 63 Comprehensive Inc. and Other (13,544.0) (14,601.0) (14,330.0) 64 Total Common Equity 18,981.0 19,299.0 22,999.0 65 66 Minority Interest 2,117.0 1,985.0 1,861.0 67 68 Total Equity 21.098.0 21.284.0 24.860.0 69 70 Total Liabilities And Equity 86.3810 87 296.0 943540 71 72 Supplemental Items 73 Total Shares Outon Filing Date 4,290.3 4,309.3 4,325,0 74 Total Shares Out. on Balance Sheet Date 4,280.0 4,302.0 75 Book Value/Share $4.43 $4.49 76 Tangible Book Value (7,785.0) (9,251.0) (11,614.0) 77 Tangible Book Value/Share ($1.82) ($2.15) ($2.69) 78 Total Debt 44,176.0 44,420.0 42,761.0 79 Net Debt 32,991.0 33,506.0 30,136.0 80 Debt Equiv. of Unfunded Proj. Benefit Obligation 677.0 775.0 NA 81 Debt Equivalent Oper. Leases 2,616.0 2,824.0 NA 82 Total Minority Interest 2,117.0 1,985.0 1,861.0 83 Equity Method Investments 19,025.0 19,273.0 17,598.0 84 Inventory Method NA NA NA 85 Raw Materials Inventory 2,180.0 2,106.0 NA 86 Finished Goods Inventory 851.0 791.0 NA 87 Other Inventory Accounts 348.0 369.0 NA 88 Land 659.0 676.0 NA 89 Buildings 4,576.0 4,782.0 NA 90 Machinery 13,686.0 14,242.0 NA 91 Full Time Employees 86,200 80,300 NA 92 Accum. Allowance for Doubtful Accts 524.0 526,0 516.0 93 Filing Date Feb-25-2021 Feb-25-2021 Feb-10-2022 94 Restatement Type NC O P 95 Calculation Type REP REP 96 97 98 Note: For multiple class companies, total share counts are primary class equivalent, and for foreign companies listed as primary ADRs, total share counts are ADR-e 99 4,325.0 $5.32 REP Restatement: Latest Filings Order: Latest on Right Conversion: Historical Decimals: Capital IQ (Default) 5 PepsiCo, Inc. (Nasdaq GS:PEP) > Financials > Income Statement 6 6 In Millions of the reported currency, except per share items. Template: Standard 8 Period Type: Annual 9 Currency: Reported Currency 10 Units: S&P Capital IQ (Default) 11 Source: Capital IQ & Proprietary C 12 13 14 Income Statement Reclassified Reclassified For the Fiscal Period Ending 12 months 12 months 15 Dec-28-2019 - Dec-26-2020 16 Currency USD USD 17 18 Revenue 67,161.0 70,372.0 19 Other Revenue 20 Total Revenue 67,161.0 70,372.0 21 22 Cost Of Goods Sold 29,983.0 31,735.0 23 Gross Profit 37,178.0 38,637.0 24 25 Selling General & Admin Exp. 25,749.0 26,988.0 26 R & D Exp. & D 711.0 719.0 27 Depreciation & Amort. 28 Other Operating Expensel(Income) (1.0) (6.0) 12 months Dec-25-2021 USD 79,474.0 79,474.0 37,045.0 42,429.0 29,961.0 752.0 4.0 29 26,459.0 27,701.0 30,717.0 10,719.0 10,936.0 11,712.0 (928.0) (1,257.0) (1,799.0) (928.0) (1,257.0) (1,799.0) 40 9.0 20.0 9,937.0 9,791.0 9,688.0 (247.0) (370.0) (55.0) (289.0) (255.0) 4.0 30 Other Operating Exp., Total 31 32 Operating Income 33 34 Interest Expense 35 Interest and Invest. Income 36 Net Interest Exp. 37 38 Currency Exchange Gains (Loss) 39 Other Non-Operating Inc. (Exp.) 40 EBT Excl. Unusual Items 41 42 Restructuring Charges 43 Merger & Related Restruct. Charges 44 Impairment of Goodwill 45 Gain (Loss) On Sale Of Assets 46 Other Unusual Items 47 EBT Incl. Unusual Items 48 49 Income Tax Expense 50 Earnings from Cont. Ops. 51 52 Earnings of Discontinued Ops. 53 Extraord. Item & Account Change 54 Net Income to Company 55 56 Minority Int. in Earnings 57 Net Income 58 Income Statement (54.0) 9,312.0 (75.0) 9,069.0 18.0 109.0 9,821.0 1,959.0 7,353.0 1,894.0 7,175.0 2,142.0 7,679.0 7,353.0 7,175.0 7,679.0 (39.0) 73140 (55.0) 7.120.0 (61.0) 76180 + 12,985.0 56 Minority Int. in Earnings (39.0) (55.0) (61.0) 57 Net Income 7.3140 7.120.0 7.6180 58 59 Pref. Dividends and Other Adj. 60 61 NI to Common Incl Extra Items 7,314.0 7,120.0 7,618.0 62 NI to Common Excl. Extra Items 7,314.0 7,120.0 7,618.0 63 64 Per Share Items 65 Basic EPS $5.23 $5.14 $5.51 66 Basic EPS Excl. Extra Items 5.23 5.14 5.51 67 Weighted Avg. Basic Shares Out. 1,399.0 1,385.0 1,382.0 68 69 Diluted EPS $5.2 $5.12 $5.49 70 Diluted EPS Excl. Extra Items 5.2 5.12 5.49 71 Weighted Avg. Diluted Shares Out. 1,407.0 1,392.0 1,389.0 72 73 Normalized Basic EPS $4.35 $4.33 $4.45 74 Normalized Diluted EPS 4.32 4.31 4.43 75 76 Dividends per Share $3.79 $4.02 $4.25 77 Payout Ratio % 72.5% 77.4% 76.3% 78 79 Shares per Depository Receipt 0.067 0.067 0.067 80 81 Supplemental Items 82 EBITDA 13,332.0 14,287.0 83 EBITA 10,800.0 11,026.0 11,803.0 84 EBIT 10,719.0 10,936.0 11,712.0 85 EBITDAR 13,465.0 13,879.0 14,868.0 86 Effective Tax Rate % 21.0% 20.9% 21.8% 87 Current Domestic Taxes 848.0 825.0 746.0 88 Current Foreign Taxes 8070 932.0 955.0 89 Total Current Taxes 1,655.0 1,757.0 1,701.0 90 Deferred Domestic Taxes 335.0 304.0 455.0 91 Deferred Foreign Taxes (31.0) (167.0) (14.0) 92 Total Deferred Taxes 304.0 137.0 441.0 93 94 Normalized Net Income 6,080.4 6.000.0 6.149.6 95 Non-Cash Pension Expense 72.0 (91.0) (497.0) 96 Filing Date Feb-10-2022 Feb-10-2022 Feb-10-2022 97 Restatement Type RC RC O 98 Calculation Type REP REP 99 100 Supplemental Operating Expense Items 101 Advertising Exp. 4,700.0 4,600.0 5,100.0 102 Selling and Marketing Exp. 15,600.0 16,500.0 18,800.0 103 R&D Exp. 711.0 719.0 752.0 104 Net Rental Exp. 480.0 547.0 581.0 105 Imputed Oper. Lease Interest Exp. 108.1 138.4 189.6 106 Imputed Oper. Lease Depreciation 371.9 408.6 391.4 107 108 Stock-Based Comp., Unallocated 243.0 274.0 322.0 109 Stock-Based Comp., Total 243.0 274.0 322.0 110 111 112 Note: For multiple class companies, per share items are primary class equivalent, and for foreign companies listed as primary ADRs, per share items are ADR-equiv Income Statement + Feb- REP dan Restatement: Latest Filings Order: Latest on Right Conversion: Historical Decimals: Capital IQ (Default) 12 months Dec-25-2021 USD 7,618.0 2,989.0 91.0 3,080.0 5 PepsiCo, Inc. (NasdaqGS:PEP) > Financials > Cash Flow 6 7 In Millions of the reported currency, except per share items. , Template: Standard 8 Period Type: Annual g Currency: Reported Currency 10 Units: S&P Capital IQ (Default) 11 Source: Capital IQ & Proprietary C 12 13 14 Cash Flow For the Fiscal Period Ending 12 months 12 months 15 Dec-28-2019 Dec-26-2020 16 Currency USD USD 17 18 Net Income 7,314.0 7,120.0 19 Depreciation & Amort. 2,597,0 2,784.0 20 Amort. of Goodwill and Intangibles 81.0 90.0 21 Depreciation & Amort., Total 2,678.0 2.874.0 22 23 Other Amortization 166.0 152.0 a 24 Asset Writedown & Restructuring Costs 20.0 34.0 25 Stock-Based Compensation 237.0 264.0 26 Other Operating Activities (287.0) 472.0 27 Change in Acc. Receivable (650.0) (420.0) uang we? 28 Change In Inventories (190.0) (516.0) 29 Change in Acc. Payable 735.0 766.0 30 Change in Inc. Taxes (287.0) (159.0) 31 Change in Other Net Operating Assets (87.0) 26.0 32 Cash from Ops. 9,649.0 10,613.0 33 34 Capital Expenditure (4,232.0) (4,240.0) ( 35 Sale of Property, Plant, and Equipment 170.0 55.0 36 Cash Acquisitions (2.717.0) (6,372.0) 37 Divestitures 253.0 6.0 38 Invest. in Marketable & Equity Securt. 97.0 (1,108.0) 39 Net (Inc.) Dec. in Loans Originated/Sold 40 Other Investing Activities (8.0) 40.0 41 Cash from Investing (6,437.0) (11,619.0) 42 76 43 Short Term Debt Issued 6.0 4,077.0 44 Long-Term Debt Issued 4.621.0 13,809.0 45 Total Debt Issued 4,627.0 17,886.0 46 Short Term Debt Repaid (5.0) (3,663.0) 47 Long-Term Debt Repaid (3,970.0) (1,830.0) 48 Total Debt Repaid (3,975.0) (5,493.0) 49 50 Issuance of Common Stock 329.0 179.0 51 Repurchase of Common Stock (3,114.0) (2,096.0) 52 53 Common Dividends Paid (5,304.0) (5,509.0) 54 Total Dividends Paid (5,304.0) (5,509.0) 55 56 Special Dividend Paid 57 Other Financing Activities (1,052.0) (1,148.0) 58 Cash from Financing (8,489.0) 3,819.0 59 60 Cocina Gynen Date Ad Cash Flow + 135.0 (9.0) 301.0 (227.0) (651.0) ( (582.0) 1,762.0 30.0 159.0 11,616.0 (4,625.0) 166.0 (61.0) 169.0 1,077.0 5.0 (3,269.0) 442.0 4,1220 4,564.0 (397.0) (3,455.0) (3,852.0) 185.0 (1980) (5,815.0) (5,815.0) (5,664.0) (10,780.0) 70 2000 ZALON 7,314.0 2,597.0 81.0 2,678.0 7,120.0 2,784.0 90.0 2,874.0 7,618.0 2,989.0 91.0 3,080.0 166.0 20.0 237.0 (287.0) (650.0) (190.0) 735.0 (287.0) (87.0) 9,649.0 152.0 34.0 264.0 472.0 (420.0) (516.0) 766.0 (159.0) 26.0 10,613.0 135.0 (9.0) 301.0 (227.0) (651.0) (582.0) 1,7620 30.0 159.0 11,616.0 (4,232.0) 170.0 (2,717.0) 253.0 97.0 (4,240.0) 55.0 (6,372.0) 6.0 (1,108.0) (4,625.0) 166.0 (61.0) 169.0 1,077.0 (8.0) (6,437.0) 40.0 (11,619.0) 5.0 (3,269.0) 18 Net Income 19 Depreciation & Amort. 20 Amort of Goodwill and Intangibles 21 Depreciation & Amort., Total 22 23 Other Amortization 24 Asset Writedown & Restructuring Costs 25 Stock-Based Compensation 26 Other Operating Activities 27 Change in Acc. Receivable 28 Change In Inventories 29 Change in Acc. Payable 30 Change in Inc. Taxes 31 Change in Other Net Operating Assets 32 Cash from Ops. 33 34 Capital Expenditure 35 Sale of Property. Plant, and Equipment 36 Cash Acquisitions 37 Divestitures 38 Invest in Marketable & Equity Securt. 39 Net (Inc.) Dec. in Loans Originated/Sold 40 Other Investing Activities 41 Cash from Investing 42 43 Short Term Debt Issued 44 Long-Term Debt Issued 45 Total Debt Issued 46 Short Term Debt Repaid 47 Long-Term Debt Repaid 48 Total Debt Repaid 49 50 Issuance of Common Stock 51 Repurchase of Common Stock 52 53 Common Dividends Paid 54 Total Dividends Paid 55 56 Special Dividend Paid 57 Other Financing Activities 58 Cash from Financing 59 60 Foreign Exchange Rate Adj. 61 Net Change in Cash 62 63 Supplemental Items 64 Cash Interest Paid 65 Cash Taxes Paid 66 Levered Free Cash Flow 67 Unlevered Free Cash Flow 68 Change in Net Working Capital 69 Net Debt Issued 70 Filing Date 71 Restatement Type 72 Calculation Type 73 6.0 4,621.0 4,627.0 (5.0) (3,970.0) (3,975.0) 4,077.0 13,809.0 17,886.0 (3,663.0) (1.830.0) (5,493.0) 442.0 4,122.0 4,564.0 (397.0) (3,455.0) (3,852.0) 329.0 (3,114.0) 179.0 (2,096.0) 185.0 (1980) (5,304.0) (5,304.0) (5,509.0) (5,509.0) (5,815.0) (5,815.0) (1,052.0) (8,489.0) (1,148.0) 3,819.0 (5,664.0) (10,780.0) 78.0 15. 1990) (129.0) 2.6840 (114.0) ( 254701. 1,076.0 2.226.0 4,954.4 5,534.4 20.0 652.0 Feb-10-2022 NC REP 1,156.0 1,770.0 5,599.4 6.385.0 (490.0) 12,393.0 Feb-10-2022 NC 1,184.0 1,933.0 5,096.6 6,221.0 11.0 712.0 Feb-10-2022 O REP REP Cash Flow + + Restatement: Latest Filings Order: Latest on Right Conversion: Historical Decimals: Capital IQ (Default) Dec-25-2021 USD 5,596.0 392.0 5,988.0 9,551.0 7,025.0 1,655.0 8,680.0 8,404.0 4,347.0 927.0 1,841.0 21,783.0 5 PepsiCo, Inc. (NasdaqGS:PEP) > Financials > Balance Sheet 6 In Millions of the reported currency, except per share items. Template: Standard Period Type: Annual 9 Currency: Reported Currency 10 Units: S&P Capital IQ (Default) 11 Source: Capital IQ & Proprietary 12 13 14 Balance Sheet Balance Sheet as of: 15 Dec-28-2019 Dec-26-2020 16 Currency USD USD 17 ASSETS 18 Cash And Equivalents 5,509.0 8,185.0 19 Short Term Investments 229.0 1,366.0 20 Total Cash & ST Investments 5,738.0 21 21 22 Accounts Receivable 6,342.0 6,691.0 23 Other Receivables 1,480.0 1,713.0 24 Total Receivables 24 7,822.0 25 26 Inventory 3,338.0 4,172.0 27 Prepaid Exp. 692.0 826.0 28 Other Current Assets 55.0 48,0 29 Total Current Assets 17,645.0 23,001.0 20 30 31 Gross Property, Plant & Equipment 44,963.0 48,010.0 32 Accumulated Depreciation (24, 110.0) (24.971.0) 33 Net Property, Plant & Equipment 20.853.0 34 - 35 Long-term Investments 15,501.0 18,757.0 37 Other Intangibles 19,315.0 38 Loans Receivable Long-Term 85.0 109,0 0 1024 39 Deferred Tax Assets, LT 4,359.0 40 Deferred Charges, LT 130.0 41 Other Long-Term Assets 1,231.0 1,403.0 42 Total Assets 92.9180 43 40 44 LIABILITIES 45 Accounts Payable 8,013.0 8,853.0 46 Accrued Exp. 4,600.0 4,994.0 47 Short-term Borrowings 47 72.0 48 Curr. Port of LT Debt 2,848.0 3,358.0 49 Curr. Port of Leases 49 Curr. 442.0 50 Other Current Liabilities 50 Other 4,486.0 5,285.0 51 Total Current Liabilities 52 52 53 53 Long-Term Debt 29,148.0 54 Long-Term Leases 54 1,118.0 12230 1,233.0 55 Pension & Other Post-Retire. Benefits 2,367.0 2,908.0 56 Def. Tax Liability, Non-Curr. 4,091.0 4,284.0 57 Other Non-Current Liabilities 6,494.0 7,199.0 58 Total Liabilities 63,679.0 79,366.0 59 60 Common Stark 22.0 22.0 Balance Sheet + 48,848.0 (24,421.0) 24,427.0 23,039.0 2,683.0 2,792.0 36 Goodwill 16,043.0 2,627.0 18,381.0 18,665.0 111.0 4,310.0 119.0 1,954.0 923770 4,3720 147.0 78.5470 9,834.0 5,411.0 436.0 4220 3,872.0 460.0 446.0 6,221.0 20,461.0 23 3720 26,220.0 40,370.0 36,026.0 1,598.0 1,668.0 4,826.0 5,888.0 76,226.0 22.0 44 LIABILITIES 45 Accounts Payable 8,013.0 8,853.0 9,834.0 46 Accrued Exp. 4,600.0 4,994.0 5,411.0 47 Short-term Borrowings 72.0 422.0 436.0 48 Curr. Port of LT Debt 2,848.0 3,358.0 3,872.0 49 Curr. Port. of Leases 442.0 460.0 446.0 50 Other Current Liabilities 4,486.0 5,285.0 6,221.0 51 Total Current Liabilities 20,461.0 23,372.0 26,220.0 52 53 Long-Term Debt 29,148.0 40,370.0 36,026.0 54 Long-Term Leases 1,118.0 1,233.0 1,598.0 55 Pension & Other Post-Retire. Benefits 2,367.0 2,908.0 1,668.0 56 Def. Tax Liability, Non-Curr. 4,091.0 4,284.0 4,826.0 57 Other Non-Current Liabilities 6,494.0 7,199.0 5,888.0 58 Total Liabilities 63,679.0 79,366.0 76,226.0 59 60 Common Stock 23.0 23.0 23.0 61 Additional Paid In Capital 3,886.0 3,910.0 4,001.0 62 Retained Earnings 61,946.0 63.443.0 65,165.0 63 Treasury Stock (36,769.0) (38,446.0) (38,248.0) 64 Comprehensive Inc. and Other (14,300.0) (15.476.0) (14,898.0) 65 Total Common Equity 14,786.0 13.454.0 16,043.0 66 67 Minority Interest 82.0 98.0 108.0 68 69 Total Equity 14.868.0 13.5520 16.151.0 70 71 Total Liabilities And Equity 78.5470 92 9180 92.377.0 72 73 Supplemental Items 74 Total Shares Out, on Filing Date 1,389.5 1,379.6 1,383.5 75 Total Shares Out. on Balance Sheet Date 1,391.0 1,380.0 1,383.0 76 Book Value/Share $10.63 $9.75 $11.6 77 Tangible Book Value (16,758.0) (24,618.0) (21,003.0) 78 Tangible Book Value/Share ($12.05) ($17.84) ($15.19) 79 Total Debt 33,628.0 45,843.0 42,378.0 80 Net Debt 27,890.0 36,292.0 36,390.0 81 Debt Equiv. of Unfunded Proj. Benefit Obligation 949.0 (137.0) 82 Debt Equivalent Oper. Leases 3,840.0 4,376.0 4,648.0 83 Total Minority Interest 82.0 98.0 108.0 84 Equity Method Investments 2,683.0 2,792.0 2,627.0 85 Inventory Method NA NA NA 86 Raw Materials Inventory 1,395.0 1,720.0 1,898.0 87 Work in Progress Inventory 200.0 205.0 151.0 88 Finished Goods Inventory 1,743,0 2.247.0 2,298.0 89 Land 1,130.0 1,171.0 1,123.0 90 Buildings 9,314.0 10.214.0 10,279.0 91 Machinery 29,390.0 31,276.0 31,486.0 92 Construction in Progress 3,169.0 3,679.0 3,940.0 93 Full Time Employees 267.000 291,000 309,000 94 Accum. Allowance for Doubtful Accts 105.0 201.0 147.0 95 Filing Date Feb-10-2022 Feb-10-2022 Feb-10-2022 96 Restatement Type NC NC O 97 Calculation Type RUP REP REP 98 99 100 Note: For multiple class companies, total share counts are primary class equivalent, and for foreign companies listed as primary ADRs, total share counts are ADR-eq 101 Balance Sheet + 1,415,0


