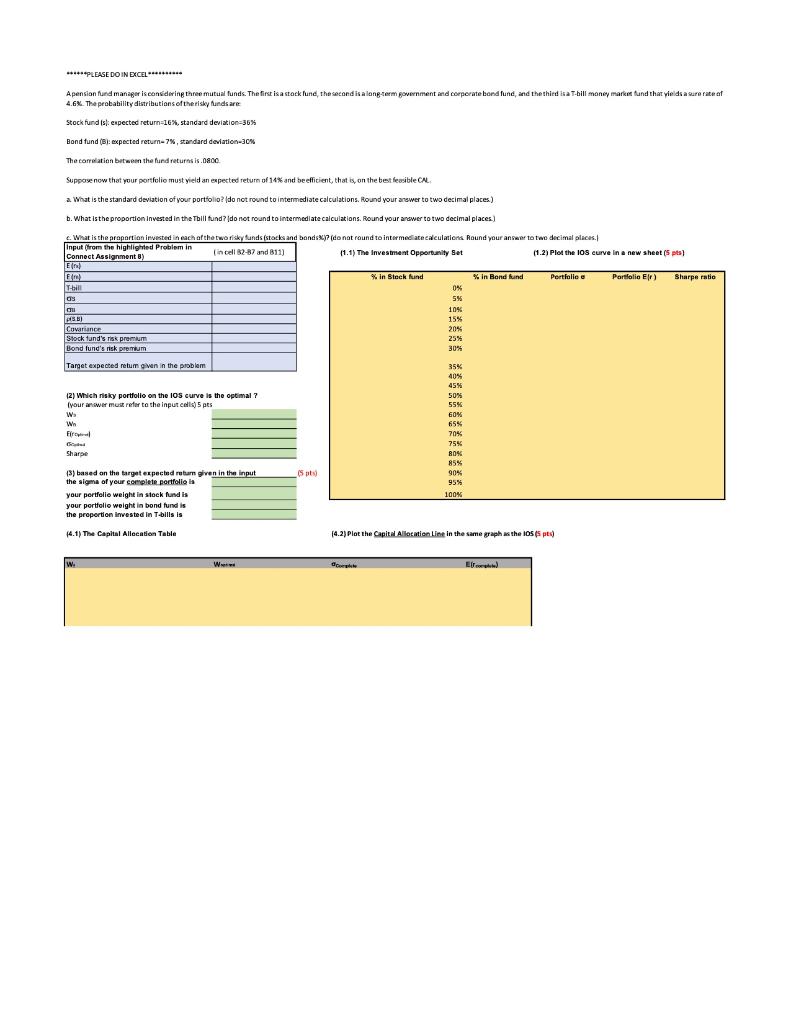
*****PLEASE DO IN EXCEL... Apension fund manager is considering three mutual funds. The first is a stacklund, the second is a long-term government and corporate bond fund, and the third isa T-bill money market fund that yields a surerate of 4.6%. The probability distributions of the risky funds are Stock fund is expected return-16%, standard deviation=36% =%= Bond fund (B) expected return-7%, standard deviation-30% The correlation between the fund return is.0800 Supporse now that your portfolio must yield an expected return of 14% and be efficient, that is on the best feasible CAL a ( a What is the standard deviation of your portfolio? do not round to intermediate calculations. Round your answer to two decimal places.) b. What is the proportion Invested in the Thill fund do not round to intermediate calculations. Round your answer to two decimal places) c. What is the proportion invested in each of the two risky funds stocks and bonds do not found to intermediate calculations. Round your answer to two decimal places. Input (from the highlighted Problem in Connect Assignment B) in cell B2-87 and 811) 11.1) The Investment Opportunity Set (1.2) Plot the 10s curve in a new sheet (5 pts) EN Fre) % in Stock And % in Bond fund Pertfalleg Portfolio Eir) Sharpe ratio T-bill 0% os 5% ou 10% AS 15% Covariance 20% Stock tund's risk premium 25% Bond lund's nisk promum 30% Target expected retum gwen in the problem (2) Which risky portfolio on the IOS curve is the optimal ? Iyour answer must refer to the input ces) 5 pts W Wh Fire | Sharpie 35% 40% 45% % 50% 55% GOM 65% 70% 75% BON 85% 90% 95% 100% (5) (3) based on the target expected return given in the input the sigma of your complete portfolio la your portfolio weight in stock fund is your portfolio weight in bond tund is the proportion invested in T-bills is 14.1) The Capital Allocation Table (4.2)Plot the Capital Allocation Line in the same graph as the 105 p) W. W *****PLEASE DO IN EXCEL... Apension fund manager is considering three mutual funds. The first is a stacklund, the second is a long-term government and corporate bond fund, and the third isa T-bill money market fund that yields a surerate of 4.6%. The probability distributions of the risky funds are Stock fund is expected return-16%, standard deviation=36% =%= Bond fund (B) expected return-7%, standard deviation-30% The correlation between the fund return is.0800 Supporse now that your portfolio must yield an expected return of 14% and be efficient, that is on the best feasible CAL a ( a What is the standard deviation of your portfolio? do not round to intermediate calculations. Round your answer to two decimal places.) b. What is the proportion Invested in the Thill fund do not round to intermediate calculations. Round your answer to two decimal places) c. What is the proportion invested in each of the two risky funds stocks and bonds do not found to intermediate calculations. Round your answer to two decimal places. Input (from the highlighted Problem in Connect Assignment B) in cell B2-87 and 811) 11.1) The Investment Opportunity Set (1.2) Plot the 10s curve in a new sheet (5 pts) EN Fre) % in Stock And % in Bond fund Pertfalleg Portfolio Eir) Sharpe ratio T-bill 0% os 5% ou 10% AS 15% Covariance 20% Stock tund's risk premium 25% Bond lund's nisk promum 30% Target expected retum gwen in the problem (2) Which risky portfolio on the IOS curve is the optimal ? Iyour answer must refer to the input ces) 5 pts W Wh Fire | Sharpie 35% 40% 45% % 50% 55% GOM 65% 70% 75% BON 85% 90% 95% 100% (5) (3) based on the target expected return given in the input the sigma of your complete portfolio la your portfolio weight in stock fund is your portfolio weight in bond tund is the proportion invested in T-bills is 14.1) The Capital Allocation Table (4.2)Plot the Capital Allocation Line in the same graph as the 105 p) W. W