Answered step by step
Verified Expert Solution
Link Copied!

Question

1 Approved Answer

Please do in Matlab and write some comments A file called avehighs.dat, stores for 3 locations the average high temperatures for each month of a
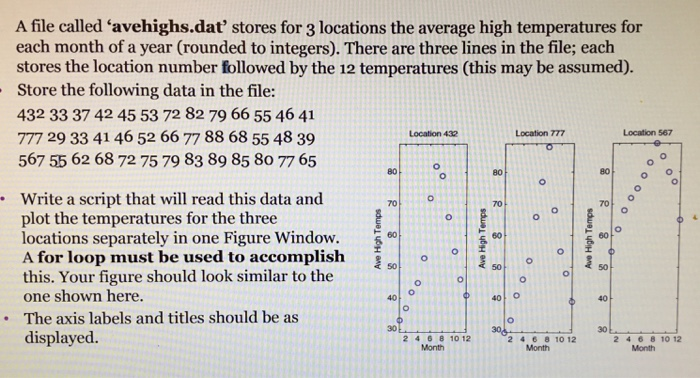
image text in transcribed
Please do in Matlab and write some comments
A file called avehighs.dat, stores for 3 locations the average high temperatures for each month of a year (rounded to integers). There are three lines in the file; each stores the location number followed by the 12 temperatures (this may be assumed). Store the following data in the file: 432 33 37 42 45 53 72 82 79 66 55 46 41 777 29 33 41 46 52 66 77 88 68 55 48 39 567 55 62 68 72 75 79 83 89 85 80 77 65 Location 432 Location 777 Location 567 Write a script that will read this data and plot the temperatures for the three 70 locations separately in one Figure Window.$ A for loop must be used to accomplish 30 this. Your figure should look similar to the one shown here. 40 The axis labels and titles should be as displayed. 210 1230240 10 12 040 0 10 12 24 6 8 10 12 24 6 8 10 12

Step by Step Solution

There are 3 Steps involved in it

Step: 1

blur-text-image

Get Instant Access to Expert-Tailored Solutions

See step-by-step solutions with expert insights and AI powered tools for academic success

Step: 2

blur-text-image

Step: 3

blur-text-image

Ace Your Homework with AI

Get the answers you need in no time with our AI-driven, step-by-step assistance

Get Started

Recommended Textbook for

More Books

Students also viewed these Databases questions