 PLEASE DO THE HISTOGRAM AS WELL
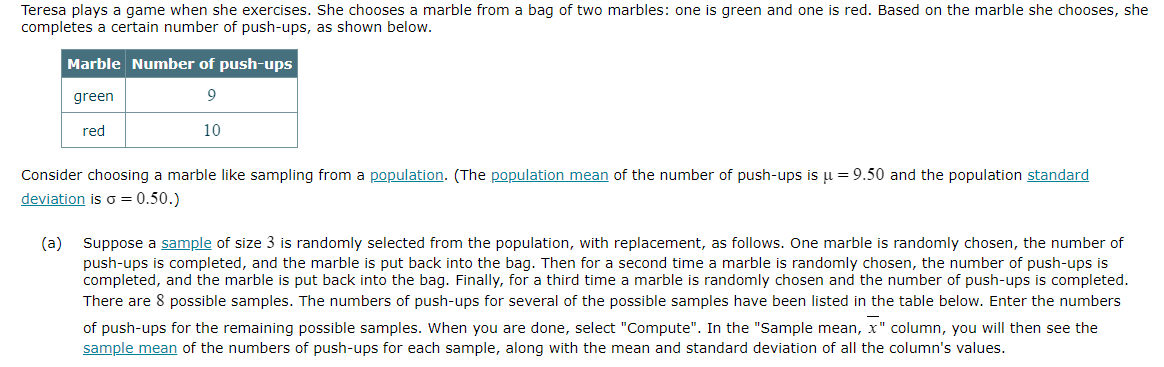
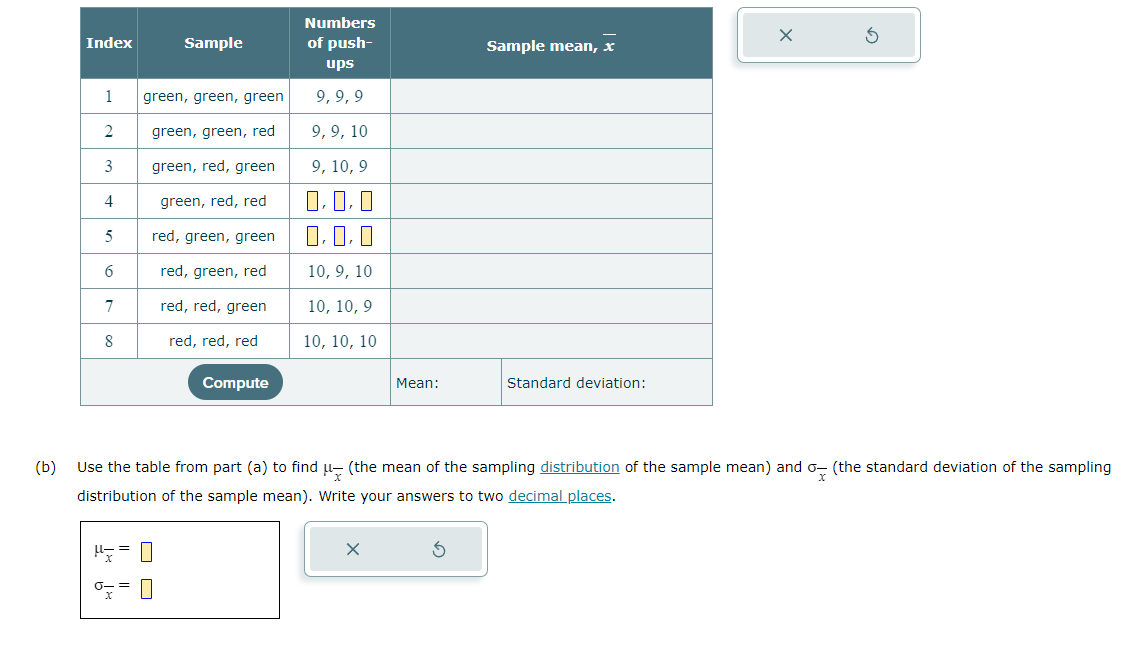
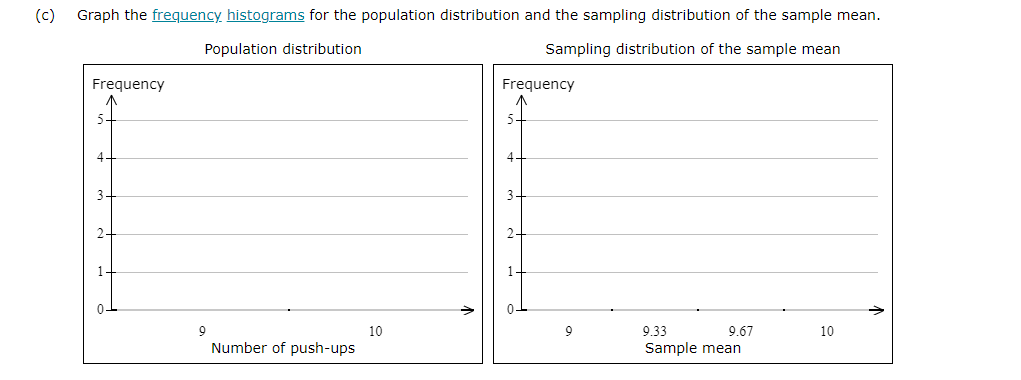
Consider choosing a marble like sampling from a population. (The population mean of the number of push-ups is =9.50 and the population standard deviation is =0.50. (a) Suppose a sample of size 3 is randomly selected from the population, with replacement, as follows. One marble is randomly chosen, the number of push-ups is completed, and the marble is put back into the bag. Then for a second time a marble is randomly chosen, the number of push-ups completed, and the marble is put back into the bag. Finally, for a third time a marble is randomly chosen and the number of push-ups is completed. There are 8 possible samples. The numbers of push-ups for several of the possible samples have been listed in the table below. Enter the numbers of push-ups for the remaining possible samples. When you are done, select "Compute". In the "Sample mean, x " column, you will then see the sample mean of the numbers of push-ups for each sample, along with the mean and standard deviation of all the column's values. (b) Use the table from part (a) to find x (the mean of the sampling distribution of the sample mean) and x (the standard deviation of the sampling distribution of the sample mean). Write your answers to two decimal places. 2) Graph the frequency histograms for the population distribution and the sampling distribution of the sample mean. Sampling distribution of the sample mean Consider choosing a marble like sampling from a population. (The population mean of the number of push-ups is =9.50 and the population standard deviation is =0.50. (a) Suppose a sample of size 3 is randomly selected from the population, with replacement, as follows. One marble is randomly chosen, the number of push-ups is completed, and the marble is put back into the bag. Then for a second time a marble is randomly chosen, the number of push-ups completed, and the marble is put back into the bag. Finally, for a third time a marble is randomly chosen and the number of push-ups is completed. There are 8 possible samples. The numbers of push-ups for several of the possible samples have been listed in the table below. Enter the numbers of push-ups for the remaining possible samples. When you are done, select "Compute". In the "Sample mean, x " column, you will then see the sample mean of the numbers of push-ups for each sample, along with the mean and standard deviation of all the column's values. (b) Use the table from part (a) to find x (the mean of the sampling distribution of the sample mean) and x (the standard deviation of the sampling distribution of the sample mean). Write your answers to two decimal places. 2) Graph the frequency histograms for the population distribution and the sampling distribution of the sample mean. Sampling distribution of the sample mean