

Answered step by step
Verified Expert Solution
Question
1 Approved Answer
Please estimate required rates of return (WACC) for the cash flows originating in Argentina from a local perspective and from a US $ perspective. UVOLOS
Please estimate required rates of return (WACC) for the cash flows originating in Argentina from a local perspective and from a US $ perspective. 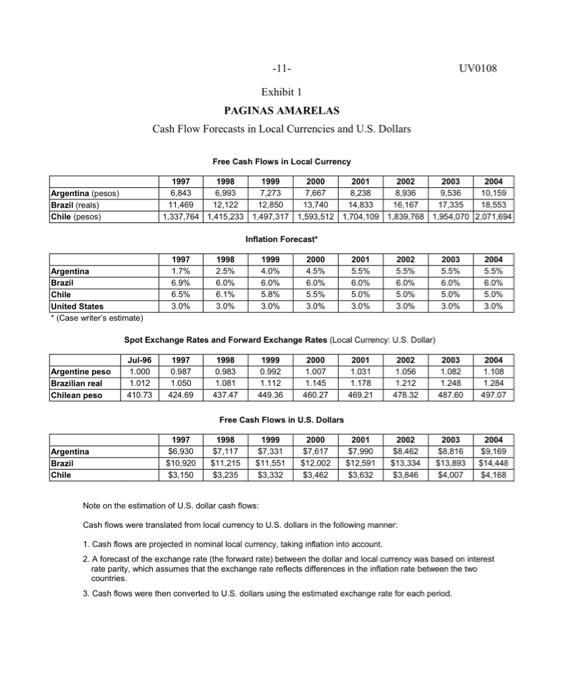
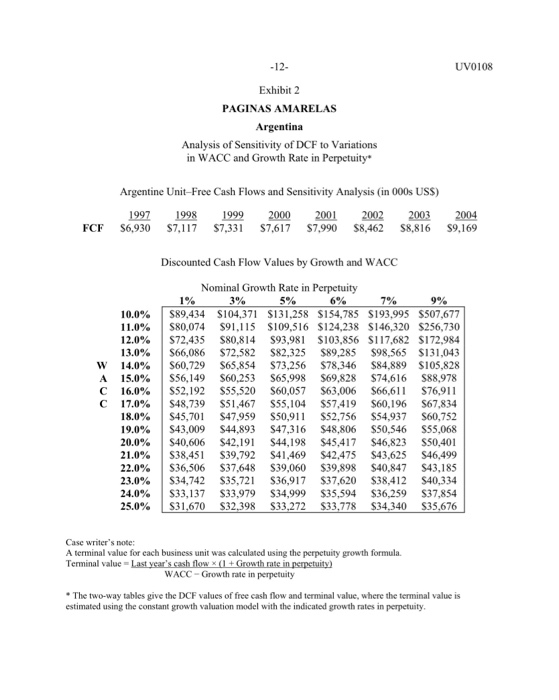

UVOLOS Exhibit PAGINAS AMARELAS Cash Flow Forecasts in Local Currencies and U.S. Dollars Free Cash Flows in Local Currency 1999 7.273 7667 Argentina (pesos) Brazil (reals) Chile (pesos) 1997 1998 2000 2001 2002 2003 2004 6,843 6.993 8.238 8,936 9,536 10,159 11,469 12,122 12,850 13,740 14,833 16,167 17.335 18,553 1.337.764 1,415,233 1.497,317 1,593,512 1.704,109 1,839.768 1.954,070 2.071.694 Inflation Forecast Argentina Brazil Chile United States (Case writer's estimate) 1997 1.7% 6.9% 6.5% 3.0% 1998 25% 6.0% 6.1% 3.0% 1999 4.0% 6.0% 5.8% 3.0% 2000 4.5% 6.0% 5.5% 3.0% 2001 5.5% 6.0% 5.0% 3.0% 2002 5.5% 6.0% 5.0% 3.0% 2003 5.5% 6.0% 5.0% 3.0% 2004 5.5% 6.0% 5.0% 3.0% Spot Exchange Rates and Forward Exchange Rates (Local Currency: US Dollar) Argentine peso Brazilian real Chilean peso Jul-96 1.000 1.012 410.73 1997 0.987 1.050 424.69 1998 0.983 1.081 437.47 1999 0.992 1.112 449.36 2000 1.007 1.145 460 27 2001 1.031 1.178 469.21 2002 1.056 1.212 478.32 2003 1.082 1.248 487.60 2004 1.108 1.284 497.07 Free Cash Flows in U.S. Dollars Argentina Brazil Chile 1997 $6,930 $10.920 $3,150 1998 $7,117 $11,215 $3,235 1999 $7,331 $11,551 $3,332 2000 $7,617 $12.002 $3,462 2001 $7.990 $12.591 $3,632 2002 $8,462 $13,334 $3,846 2003 $8,816 $13.893 $4,007 2004 $9.169 $14.448 $4,168 Note on the estimation of U.S. dollar cash flows: Cash flows were translated from local currency to U.S. dollars in the following manner. 1. Cash flows are projected in nominal local currency, taking inflation into account. 2. A forecast of the exchange rate (the forward rate) between the dollar and local currency was based on interest rate parity, which assumes that the exchange rate reflects differences in the inflation rate between the two countries 3. Cash flows were then converted to U.S. dollars using the estimated exchange rate for each period. -12- UV0108 Exhibit 2 PAGINAS AMARELAS Argentina Analysis of Sensitivity of DCF to Variations in WACC and Growth Rate in Perpetuity Argentine Unit-Free Cash Flows and Sensitivity Analysis (in 000s USS) 1997 1998 1999 2000 2001 2002 56,930 $7,117 $7,331 S7,617 87,990 $8,462 $8,816 2003 2004 $9,169 FCF 10.0% 11.0% 12.0% 13.0% W 14.0% A 15.0% C 16.0% C 17.0% 18.0% 19.0% 20.0% 21.0% 22.0% 23.0% 24.0% 25.0% Discounted Cash Flow Values by Growth and WACC Nominal Growth Rate in Perpetuity 1% 3% 5% 6% 7% 9% 589,434 S104,371 $131,258 S154,785 S193,995 $507,677 $80,074 $91,115 $109,516 $124,238 $146,320 $256,730 S72,435 $80,814 $93,981 $103.856 $117,682 $172,984 S66,086 $72,582 $82,325 $89,285 $98,565 $131,043 $60,729 S65,854 $73,256 $78,346 $84.889 $105,828 S56,149 S60,253 365,998 $69.828 $74,616 $88,978 S52,192 $55,520 S60,057 $63,006 S66,611 $76,911 S48,739 $51,467 S55,104 $57,419 S60, 196 S67.834 $45,701 $47,959 $50,911 $52,756 $54,937 $60,752 S43,009 $44,893 S47,316 $48,806 $50,546 $55,068 S40,606 S42,191 S44,198 $45,417 $46,823 $50,401 38,451 $39,792 S41,469 S42,475 $43,625 S46,499 S36,506 $37,648 $39,060 $39,898 $40,847 S43.185 $34,742 $35,721 $36,917 $37,620 $38,412 S40,334 $33,137 $33,979 $34,999 $35,594 $36,259 $37,854 $31,670 $32,398 $33,272 $33,778 $34,340 S35,676 Case writer's note: A terminal value for each business unit was calculated using the perpetuity growth formula. Terminal value Last year's cash flow X(1 + Growth rate in perpetuity) WACC - Growth rate in perpetuity The two-way tables give the DCF values of free cash flow and terminal value, where the terminal value is estimated using the constant growth valuation model with the indicated growth rates in perpetuity. Determining the cost of debt Lopez needed to estimate the WACC with which to discount free cash flows from Argentina, Brazil, and Chile. He decided to start with the easiest part, estimating the cost of debt. Brasil Investimentos' executives had stated that the country operations had not borrowed money at the corporate level or as one entity (i.e., the three country operations together as the telephone-directory subsidiary), but only at the country level. Lopez's assessment was that all three local operations were relatively small to issue debt independently in the international markets. They would have to rely on the local markets for their borrowing needs. With that in mind, Lopez called J.P. Morgan bankers working at the credit department in offices located in the three countries. He was able to get from them an estimate of the U.S. dollar rates at which each country unit could expect to borrow (see Exhibit 14 for estimated borrowing rates, tax rates, and long-term capital structure). Determining the cost of equity In pursuing the next step, calculating the cost of equity, Lopez could choose between two different approaches under the CAPM method (capital asset pricing model). One approach would be to use local markets' parameters (local risk-free rate, local market premium, and beta). The other approach would be to use U.S. market parameters to come up with a cost of equity, which would then be adjusted to reflect the country risk. The first path offered several difficulties. Lopez had problems in determining a risk-free rate for each country. He questioned whether there was such a thing as a risk-free rate for countries like Argentina, Brazil, and Chile. He knew that even sovereign bonds, like Brady bonds," offered risk of default, because the governments of these countries had defaulted on debt and interest payments in the recent past. Most of the players were subsidiaries of large, diversified companies. Brady bonds were U.S.-dollar-denominated bonds issued by governments of developing countries that were used as exchange for existing bank loans in default. The principal payments of those securities were collateralized (partly or in total) by U.S.-government zero-coupon bonds. UV0108 Another challenge was estimating equity-risk premiums for each market. Lopez knew that there was little historical data on equity markets for most Latin American countries. He also realized that any available data usually covered short periods of time. Furthermore, most companies in Argentina, Brazil, and Chile were family owned, and many of them were not listed on stock exchanges. Of the companies listed, very few were heavily traded and had enough liquidity. Lopez realized that any equity-risk premium derived from the available data would not be a good estimate of the premium that investors required when undertaking equity investments in the respective countries. In addition, he could not find any relevant pure-play competitor in the telephone- directory industry. Substantially all the companies operating in this industry owned other types of businesses. Those that did not were too small to provide a realistic comparison. Lopez then wondered how he could come up with a beta for Paginas Amarelas. Given the difficulties and potential flaws posed by the first alternative, Lopez considered using either of two approaches. The first obtained a cost of equity using U.S. parameters but adjusted for country risks stemming from the local political and capital-market environments. ' The second approach posed the challenge of estimating the "adjusting factors that would correctly reflect the higher risk offered by equity investments in Argentina, Brazil, and Chile (while still leaving unanswered the question of which beta to use). Lopez sat back and started to think about the appropriate "adjusting factors." Risk ratings by institutions like the Economist Intelligence Unit (EIU) and DRI/McGraw-Hill furnished some indication of country risk. Risk ratings (Table 2) were estimated using several economic data and economic ratios/like the ratio of debt service to exports or foreign reserves and tried to take into account the political situation in the country. Lopez debated whether these ratings were relevant to the valuation that he was conducting. Looking at the EIU risk ratings below, he questioned whether they implied that making an investment in Brazil would be more than two times riskier than making the same investment in Chile. Table 2. EIU risk ratings by country. Argentina Brazil Chile EIU risk rating 65 60 25 Source: J.P. Morgan & Co. document, The idea of calculating a WACC in U.S. dollars and adjusting it with an estimate of country risks brought additional questions to mind: Was this methodology theoretically sound? Should he use one "adjusting factor for all Latin American countries or one for each country? 15 One study found that political-risk premiums and country beta were correlated 40%, which suggests that to use both terms in a CAPM might overstate country risk. One solution was to multiply the country beta by 0.60 to avoid double-counting country risk. UVOLOS Exhibit PAGINAS AMARELAS Cash Flow Forecasts in Local Currencies and U.S. Dollars Free Cash Flows in Local Currency 1999 7.273 7667 Argentina (pesos) Brazil (reals) Chile (pesos) 1997 1998 2000 2001 2002 2003 2004 6,843 6.993 8.238 8,936 9,536 10,159 11,469 12,122 12,850 13,740 14,833 16,167 17.335 18,553 1.337.764 1,415,233 1.497,317 1,593,512 1.704,109 1,839.768 1.954,070 2.071.694 Inflation Forecast Argentina Brazil Chile United States (Case writer's estimate) 1997 1.7% 6.9% 6.5% 3.0% 1998 25% 6.0% 6.1% 3.0% 1999 4.0% 6.0% 5.8% 3.0% 2000 4.5% 6.0% 5.5% 3.0% 2001 5.5% 6.0% 5.0% 3.0% 2002 5.5% 6.0% 5.0% 3.0% 2003 5.5% 6.0% 5.0% 3.0% 2004 5.5% 6.0% 5.0% 3.0% Spot Exchange Rates and Forward Exchange Rates (Local Currency: US Dollar) Argentine peso Brazilian real Chilean peso Jul-96 1.000 1.012 410.73 1997 0.987 1.050 424.69 1998 0.983 1.081 437.47 1999 0.992 1.112 449.36 2000 1.007 1.145 460 27 2001 1.031 1.178 469.21 2002 1.056 1.212 478.32 2003 1.082 1.248 487.60 2004 1.108 1.284 497.07 Free Cash Flows in U.S. Dollars Argentina Brazil Chile 1997 $6,930 $10.920 $3,150 1998 $7,117 $11,215 $3,235 1999 $7,331 $11,551 $3,332 2000 $7,617 $12.002 $3,462 2001 $7.990 $12.591 $3,632 2002 $8,462 $13,334 $3,846 2003 $8,816 $13.893 $4,007 2004 $9.169 $14.448 $4,168 Note on the estimation of U.S. dollar cash flows: Cash flows were translated from local currency to U.S. dollars in the following manner. 1. Cash flows are projected in nominal local currency, taking inflation into account. 2. A forecast of the exchange rate (the forward rate) between the dollar and local currency was based on interest rate parity, which assumes that the exchange rate reflects differences in the inflation rate between the two countries 3. Cash flows were then converted to U.S. dollars using the estimated exchange rate for each period. -12- UV0108 Exhibit 2 PAGINAS AMARELAS Argentina Analysis of Sensitivity of DCF to Variations in WACC and Growth Rate in Perpetuity Argentine Unit-Free Cash Flows and Sensitivity Analysis (in 000s USS) 1997 1998 1999 2000 2001 2002 56,930 $7,117 $7,331 S7,617 87,990 $8,462 $8,816 2003 2004 $9,169 FCF 10.0% 11.0% 12.0% 13.0% W 14.0% A 15.0% C 16.0% C 17.0% 18.0% 19.0% 20.0% 21.0% 22.0% 23.0% 24.0% 25.0% Discounted Cash Flow Values by Growth and WACC Nominal Growth Rate in Perpetuity 1% 3% 5% 6% 7% 9% 589,434 S104,371 $131,258 S154,785 S193,995 $507,677 $80,074 $91,115 $109,516 $124,238 $146,320 $256,730 S72,435 $80,814 $93,981 $103.856 $117,682 $172,984 S66,086 $72,582 $82,325 $89,285 $98,565 $131,043 $60,729 S65,854 $73,256 $78,346 $84.889 $105,828 S56,149 S60,253 365,998 $69.828 $74,616 $88,978 S52,192 $55,520 S60,057 $63,006 S66,611 $76,911 S48,739 $51,467 S55,104 $57,419 S60, 196 S67.834 $45,701 $47,959 $50,911 $52,756 $54,937 $60,752 S43,009 $44,893 S47,316 $48,806 $50,546 $55,068 S40,606 S42,191 S44,198 $45,417 $46,823 $50,401 38,451 $39,792 S41,469 S42,475 $43,625 S46,499 S36,506 $37,648 $39,060 $39,898 $40,847 S43.185 $34,742 $35,721 $36,917 $37,620 $38,412 S40,334 $33,137 $33,979 $34,999 $35,594 $36,259 $37,854 $31,670 $32,398 $33,272 $33,778 $34,340 S35,676 Case writer's note: A terminal value for each business unit was calculated using the perpetuity growth formula. Terminal value Last year's cash flow X(1 + Growth rate in perpetuity) WACC - Growth rate in perpetuity The two-way tables give the DCF values of free cash flow and terminal value, where the terminal value is estimated using the constant growth valuation model with the indicated growth rates in perpetuity. Determining the cost of debt Lopez needed to estimate the WACC with which to discount free cash flows from Argentina, Brazil, and Chile. He decided to start with the easiest part, estimating the cost of debt. Brasil Investimentos' executives had stated that the country operations had not borrowed money at the corporate level or as one entity (i.e., the three country operations together as the telephone-directory subsidiary), but only at the country level. Lopez's assessment was that all three local operations were relatively small to issue debt independently in the international markets. They would have to rely on the local markets for their borrowing needs. With that in mind, Lopez called J.P. Morgan bankers working at the credit department in offices located in the three countries. He was able to get from them an estimate of the U.S. dollar rates at which each country unit could expect to borrow (see Exhibit 14 for estimated borrowing rates, tax rates, and long-term capital structure). Determining the cost of equity In pursuing the next step, calculating the cost of equity, Lopez could choose between two different approaches under the CAPM method (capital asset pricing model). One approach would be to use local markets' parameters (local risk-free rate, local market premium, and beta). The other approach would be to use U.S. market parameters to come up with a cost of equity, which would then be adjusted to reflect the country risk. The first path offered several difficulties. Lopez had problems in determining a risk-free rate for each country. He questioned whether there was such a thing as a risk-free rate for countries like Argentina, Brazil, and Chile. He knew that even sovereign bonds, like Brady bonds," offered risk of default, because the governments of these countries had defaulted on debt and interest payments in the recent past. Most of the players were subsidiaries of large, diversified companies. Brady bonds were U.S.-dollar-denominated bonds issued by governments of developing countries that were used as exchange for existing bank loans in default. The principal payments of those securities were collateralized (partly or in total) by U.S.-government zero-coupon bonds. UV0108 Another challenge was estimating equity-risk premiums for each market. Lopez knew that there was little historical data on equity markets for most Latin American countries. He also realized that any available data usually covered short periods of time. Furthermore, most companies in Argentina, Brazil, and Chile were family owned, and many of them were not listed on stock exchanges. Of the companies listed, very few were heavily traded and had enough liquidity. Lopez realized that any equity-risk premium derived from the available data would not be a good estimate of the premium that investors required when undertaking equity investments in the respective countries. In addition, he could not find any relevant pure-play competitor in the telephone- directory industry. Substantially all the companies operating in this industry owned other types of businesses. Those that did not were too small to provide a realistic comparison. Lopez then wondered how he could come up with a beta for Paginas Amarelas. Given the difficulties and potential flaws posed by the first alternative, Lopez considered using either of two approaches. The first obtained a cost of equity using U.S. parameters but adjusted for country risks stemming from the local political and capital-market environments. ' The second approach posed the challenge of estimating the "adjusting factors that would correctly reflect the higher risk offered by equity investments in Argentina, Brazil, and Chile (while still leaving unanswered the question of which beta to use). Lopez sat back and started to think about the appropriate "adjusting factors." Risk ratings by institutions like the Economist Intelligence Unit (EIU) and DRI/McGraw-Hill furnished some indication of country risk. Risk ratings (Table 2) were estimated using several economic data and economic ratios/like the ratio of debt service to exports or foreign reserves and tried to take into account the political situation in the country. Lopez debated whether these ratings were relevant to the valuation that he was conducting. Looking at the EIU risk ratings below, he questioned whether they implied that making an investment in Brazil would be more than two times riskier than making the same investment in Chile. Table 2. EIU risk ratings by country. Argentina Brazil Chile EIU risk rating 65 60 25 Source: J.P. Morgan & Co. document, The idea of calculating a WACC in U.S. dollars and adjusting it with an estimate of country risks brought additional questions to mind: Was this methodology theoretically sound? Should he use one "adjusting factor for all Latin American countries or one for each country? 15 One study found that political-risk premiums and country beta were correlated 40%, which suggests that to use both terms in a CAPM might overstate country risk. One solution was to multiply the country beta by 0.60 to avoid double-counting country risk Step by Step Solution
There are 3 Steps involved in it
Step: 1

Get Instant Access to Expert-Tailored Solutions
See step-by-step solutions with expert insights and AI powered tools for academic success
Step: 2

Step: 3
Ace Your Homework with AI
Get the answers you need in no time with our AI-driven, step-by-step assistance
Get Started
Implementing And Auditing The Internal Control System
Authors: D. Chorafas
2001edition
0333929365, 978-0333929360