please expalin question breifly thank you .
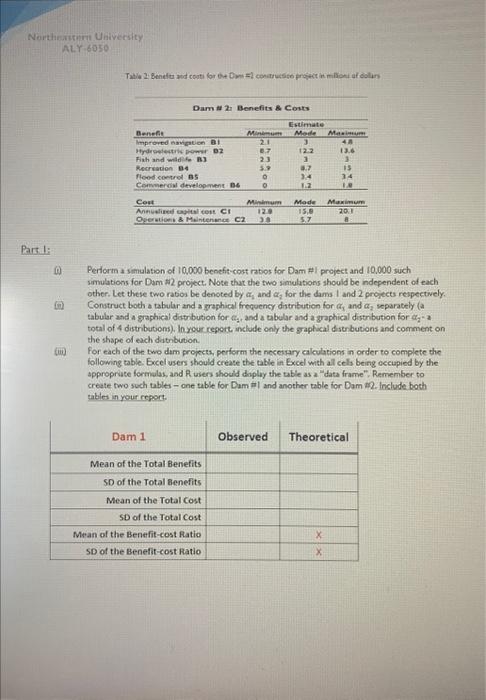
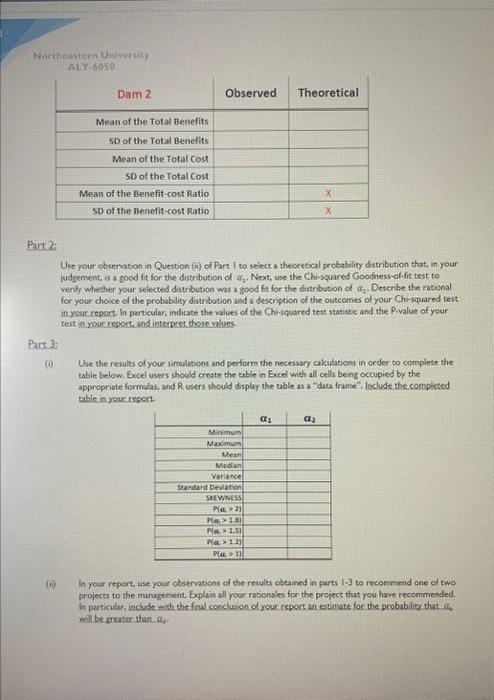
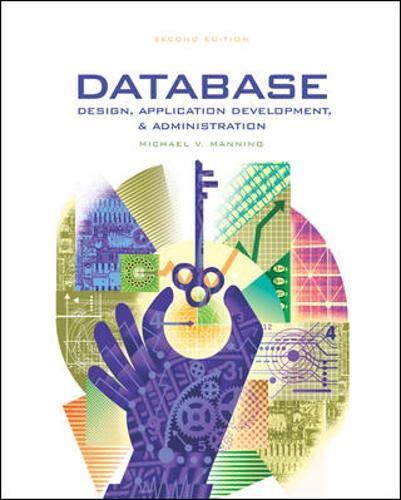
The project conasts of three partc. The sulmisson of this project will const of two attachnente 1. A Word document that is prepared accoring to the APA standards of formatting in the Word document, exphan the experiments and ther respective conclusions, and additional information as indicated in each problem. Stve your word dociment in the format ALY Y050. MOD2Profect LastNameFintinitialdoox 2. Ether an Excel worlbook or an R script file ( R fle) that contzins all the work and the alculavis indisated in parts L3 of the proicct if ang Eocel, all work shiould be completed in the Excel workbook provided. Furthermore, they should be completed in the designsted cells as mutructed in the workbook. Please save your Excel worlbook or R script fle in the following format Excek A Yooso_MCD2Project__Lastantef irstinital, for example. ALY6050 MOD2Project_Dowl. Problem: Corporations have to select amiong many projects that are under consideration by the management. Their primary instrument for evaluating and selecting among the avaibble projects is the benefocost cnojgis. In this analysiz, both the annual benefits and the annual costs deriving from a project are estimated in several different categones. Then the total benefit is dinded by the total cost to produce a beneft cost ratio. This ratio is then used by corporations to compare numerous projects under consideration. A benefit-cost ranio greater than 1.0 indicates that the benefirs are greater than the costs, and the higher a project's benefit-cost ratio, the more likely it is to be selected over projects with lower ratios. Currently, the JET Corporation is evaluating two dam propect constructions, one in southwert Georgia (Dam \#1) and the other in Narth Carolins (Dam H2). The company has identified soc areas of benefits: improved navigation, hydroelectic pomer, foh and wildit, recreaton, food controh and the commercial development of the area. Furthermore there are three estmates availbble for each type benefit - a minimum possible value, a most thely value (ve, a mode or peak), and a maximam possible value. For the costs, two categories associated with a construction project of this type have been identled: the total capital cost, anmulized over 30 ycars (at a nte specifed by the credtors and the government), and the annual operations and maintenance coss. These benefits and costs estimations for both dam projects fin millions of doltars) are as follows: (1) Periorm a simulation of 10,000 benefit-cost rabios for Dam H1 project and 10.000 such smulations for Dam 12 project. Note that the two simulations should be independent of each other. Let these two rabios be denoted by 1 and 2 for the dams 1 and 2 prejects respectively. (i) Construct both a tabular and a graphical frequency diveritution for a3 and a2 separately (a tabular and a graphical ditrrbution for a3 and a t tibular and a gaphical distn bution for e2a total of 4 distributions). la your repert include only the gaptical diserbutions and comment on the shape of each dititibution. (iii) for each of the two dem projects, perform the necesary alculations in order to complete the. following table. Excel users should create the table in Excel with al cels being eccupied by the approprise formulss, and f. users should daplay the cable as a "data frame". Remember to create two such tables - one sable for Dam 1 and another table for Dam 12 . include both gables in your roport. Northeastom University MLY6050 Pirt 2 Use your observasion in Question (ii) of Part I to select a theoretical probablity datribution that, in your judgensent, is a good fit for the dismibution of a a1. Next, use the Chi-iquared Goodness-of-fit test to verily whecher your uelected distribution was a good fic for the datrbution of 4. Describe the rational for your choice of the probubility distribution and a description of the outcomes of your Ch-qquared teit in your report In particular, indicate the values of the Chi-squared teit statiste and the Pivalue of your test in your regorti and interpret thore alues. Pirt 3: (0) Uie the rewils of your simulations and perform the necessy calculations in order to complete the table below. Excel users shoold crate the cable in Excel wath all cells beng occupied by the appropriate formulas, and R users shouls dipphy the uble as a "daes frane". Include the completed table in youc repart. (ii) In your report, use your observations of the reuits obesined in parts i.3 to recaminend ane of two projects to the managenient Explain all your rationales for the project that you have recommended. In particular, inclde wich she fiaal conclusion of your ireport an estimate for the probabilig that 4 will be zreater than 9