Answered step by step
Verified Expert Solution
Link Copied!

Question

1 Approved Answer

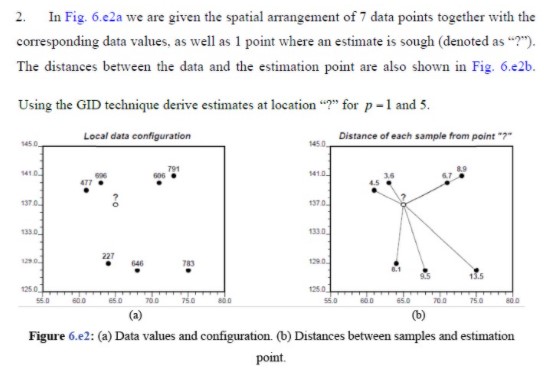
Please explain and help solve. 2. In Fig. 6.e2a we are given the spatial arrangement of 7 data points together with the corresponding data values,

Please explain and help solve.

image text in transcribed
2. In Fig. 6.e2a we are given the spatial arrangement of 7 data points together with the corresponding data values, as well as 1 point where an estimate is sough (denoted as "?"). The distances between the data and the estimation point are also shown in Fig. 6.e2b. Using the GID technique derive estimates at location "?" for p -1 and 5. Local data configuration Distance of each sample from point "?" 1450 145 0 791 ET ATT 1370 135 0 1310 227 12510 56.0 60 0 TOO 750 56.0 8510 7010 750 (a) (b) Figure 6.e2: (a) Data values and configuration. (b) Distances between samples and estimation point

Step by Step Solution

There are 3 Steps involved in it

Step: 1

blur-text-image

Get Instant Access to Expert-Tailored Solutions

See step-by-step solutions with expert insights and AI powered tools for academic success

Step: 2

blur-text-image

Step: 3

blur-text-image

Ace Your Homework with AI

Get the answers you need in no time with our AI-driven, step-by-step assistance

Get Started

Recommended Textbook for

Calculus An Applied Approach

Authors: Ron Larson, Dennis J McKenzie, Larson/Edwards, Bruce H Edwards

7th Edition

ISBN: 1111809720, 9781111809720

More Books

Students also viewed these Mathematics questions

Question

Compare the different types of employee separation actions.

Answered: 1 week ago

Question

Assess alternative dispute resolution methods.

Answered: 1 week ago

Question

Distinguish between intrinsic and extrinsic rewards.

Answered: 1 week ago