

Answered step by step
Verified Expert Solution
Question
1 Approved Answer
please explain how you got answers 19. Variance and standard deviation The most common measures of dispersion are the variance and the standard deviation. These
please explain how you got answers 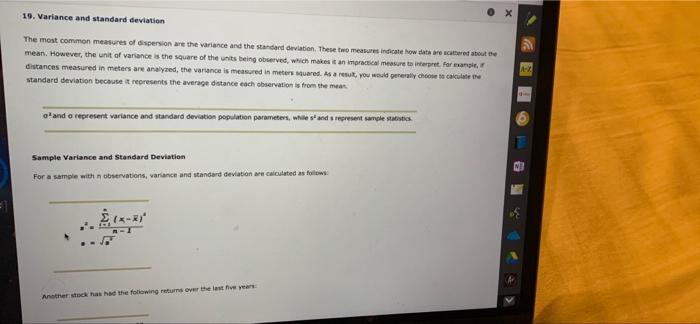
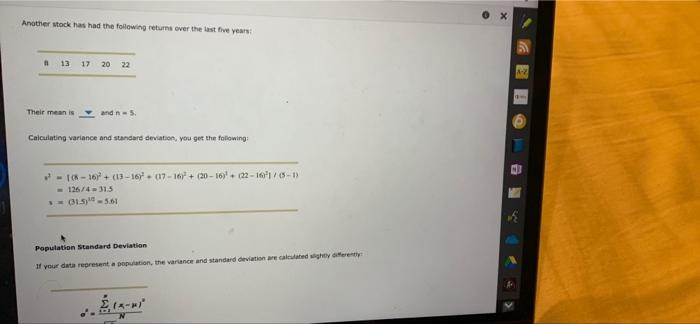
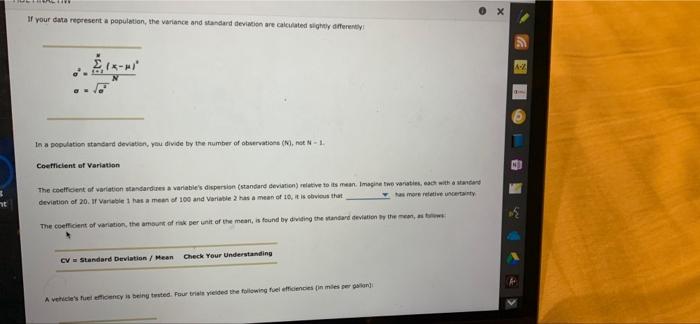
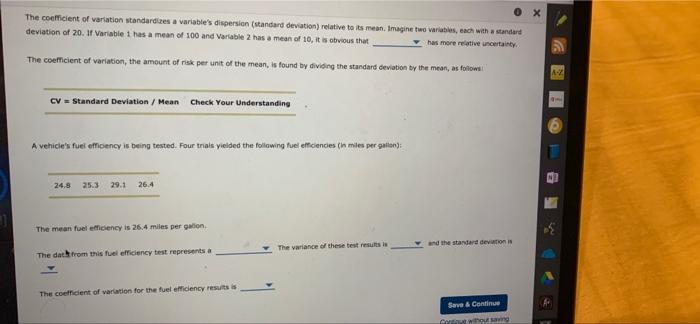
19. Variance and standard deviation The most common measures of dispersion are the variance and the standard deviation. These two measure indicate howed out mean. However, the unit of variance is the square of the units being observed, which makes it an impractical measure to interpret. For mange, distances measured in meters are analyzed, the variance is measured in meters Muared. As a result you would generally choose to calculate standard deviation because it represents the average distance each observations from the mean a and a represent variance and standard deviation population parameters, while sandsrepresent sample statistics Sample Variance and Standard deviation For a sample with observations, variance and standard deviation are calculated as follow Another stock has had the following returns over the last five years OX Another stock has had the following returns over the last five years 13 17 20 22 Their mean is and 5 Calculating variance and standard deviation, you get the following: P = [ R = 1 + (13 16h - (17 + (20 16}} + 22 1+ 45 - 1) 126/4315 01.5-5.61 Population Standard Deviation If your data representation, the variance and standard deviation are called where O X If your data represent a population, the variance and standard deviation are calculated slightly differently r- A In a population standard deviation, you divide by the number of observations (N,N-1 Coefficient of Variation 3 ht The cocent of variation standardes variables dispersion (standard deviation relative to its mean Imagine two variation with and deviation of 20. 1 Varehas a means of 100 and Variable has a mean of 10, it is his that a more relative a The coefficient of variation, the amount of risk per unit of the mean, is found by dividing the standard deviation by the man CV Standard Deviation / Hean Check Your Understanding A veulency is being twated Pour triste yielded the following fuel efficiencies in mies per ox The coefficient of variation standardizes a variable's dispersion (standard deviation relative to its mean, Imagine two variables, each with a standard deviation of 20. If Variable 1 has a mean of 100 and Variable 2 has a mean of 10, it is obvious that has more relative uncertainty The coefficient of variation, the amount of risk per unit of the mean, is found by dividing the standard deviation by the mean, as follows: A- CV = Standard Deviation / Mean Check Your Understanding A vehicle's fuel efficiency is being tested. Four trials yielded the following fuel efficiencies in miles per gaton): 24.8 25.3 29.1 26.4 The mean fuel efficiency is 26.4 miles per gation The variance of these test results is and the standard devo The dath from this fuel efficiency test represents a The coefficient of variation for the fuel efficiency results is Save & Continue Cuang Step by Step Solution
There are 3 Steps involved in it
Step: 1

Get Instant Access to Expert-Tailored Solutions
See step-by-step solutions with expert insights and AI powered tools for academic success
Step: 2

Step: 3
Ace Your Homework with AI
Get the answers you need in no time with our AI-driven, step-by-step assistance
Get Started
Take The Trade A Floor Trade
Authors: Tony Wilson
1st Edition
979-8218195458