

Question
please explain in extensive detail the slope, beta, t stat, p value r square, alpha, last ratio on the stats and regression graph and a
please explain in extensive detail the slope, beta, t stat, p value r square, alpha, last ratio on the stats and regression graph and a financial analysis of costco from the regression analysis.
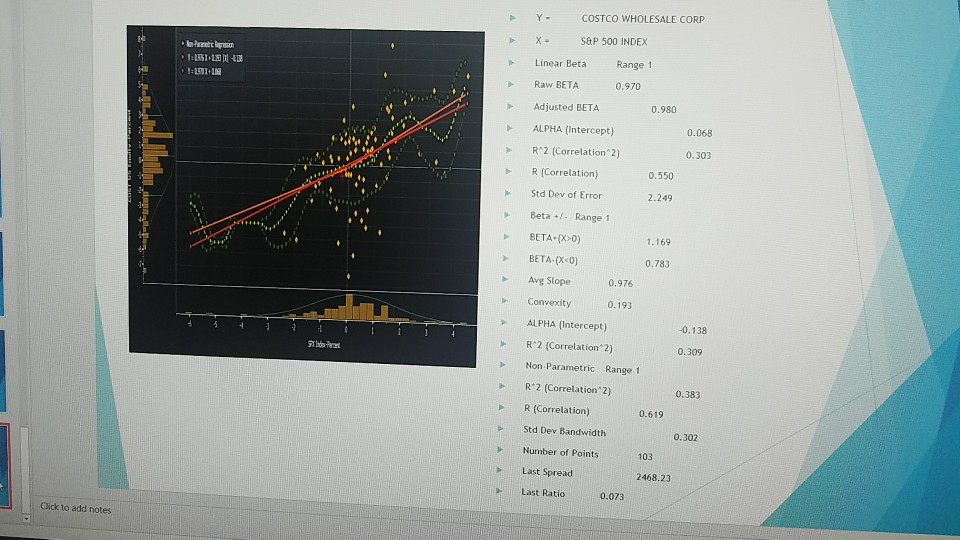
Y-COSTCO WHOLESALE CORP SEP 500 INDEX Linear Beta Range 1 Raw BETA Adjusted BETA ALPHA (Intercept) R 2 (Correlation 2) R (Correlation) Std Dev of Error 0.970 0.980 0.303 0.550 2.249 Beta Range 1 BETA poo) 1.169 0.783 BETA-(Xc0) Avg Slope Convexity ALPHA (Intercept) 0.976 0.193 -0.138 R2 (Correlation 2) 0.309 ?! Non Parametric Range 1 R 2 (Correlation 2) 0.383 R (Correlation) Std Dev Bandwidth Number of Points Last Spread 0.619 0.302 103 2468.23 Last Ratio .073 Click to add notes
Step by Step Solution
There are 3 Steps involved in it
Step: 1

Get Instant Access to Expert-Tailored Solutions
See step-by-step solutions with expert insights and AI powered tools for academic success
Step: 2

Step: 3
Ace Your Homework with AI
Get the answers you need in no time with our AI-driven, step-by-step assistance
Get Started
Economics For Investment Decision Makers
Authors: Sandeep Singh, Christopher D Piros, Jerald E Pinto
1st Edition
1118111966, 9781118111963