please explain question step by step
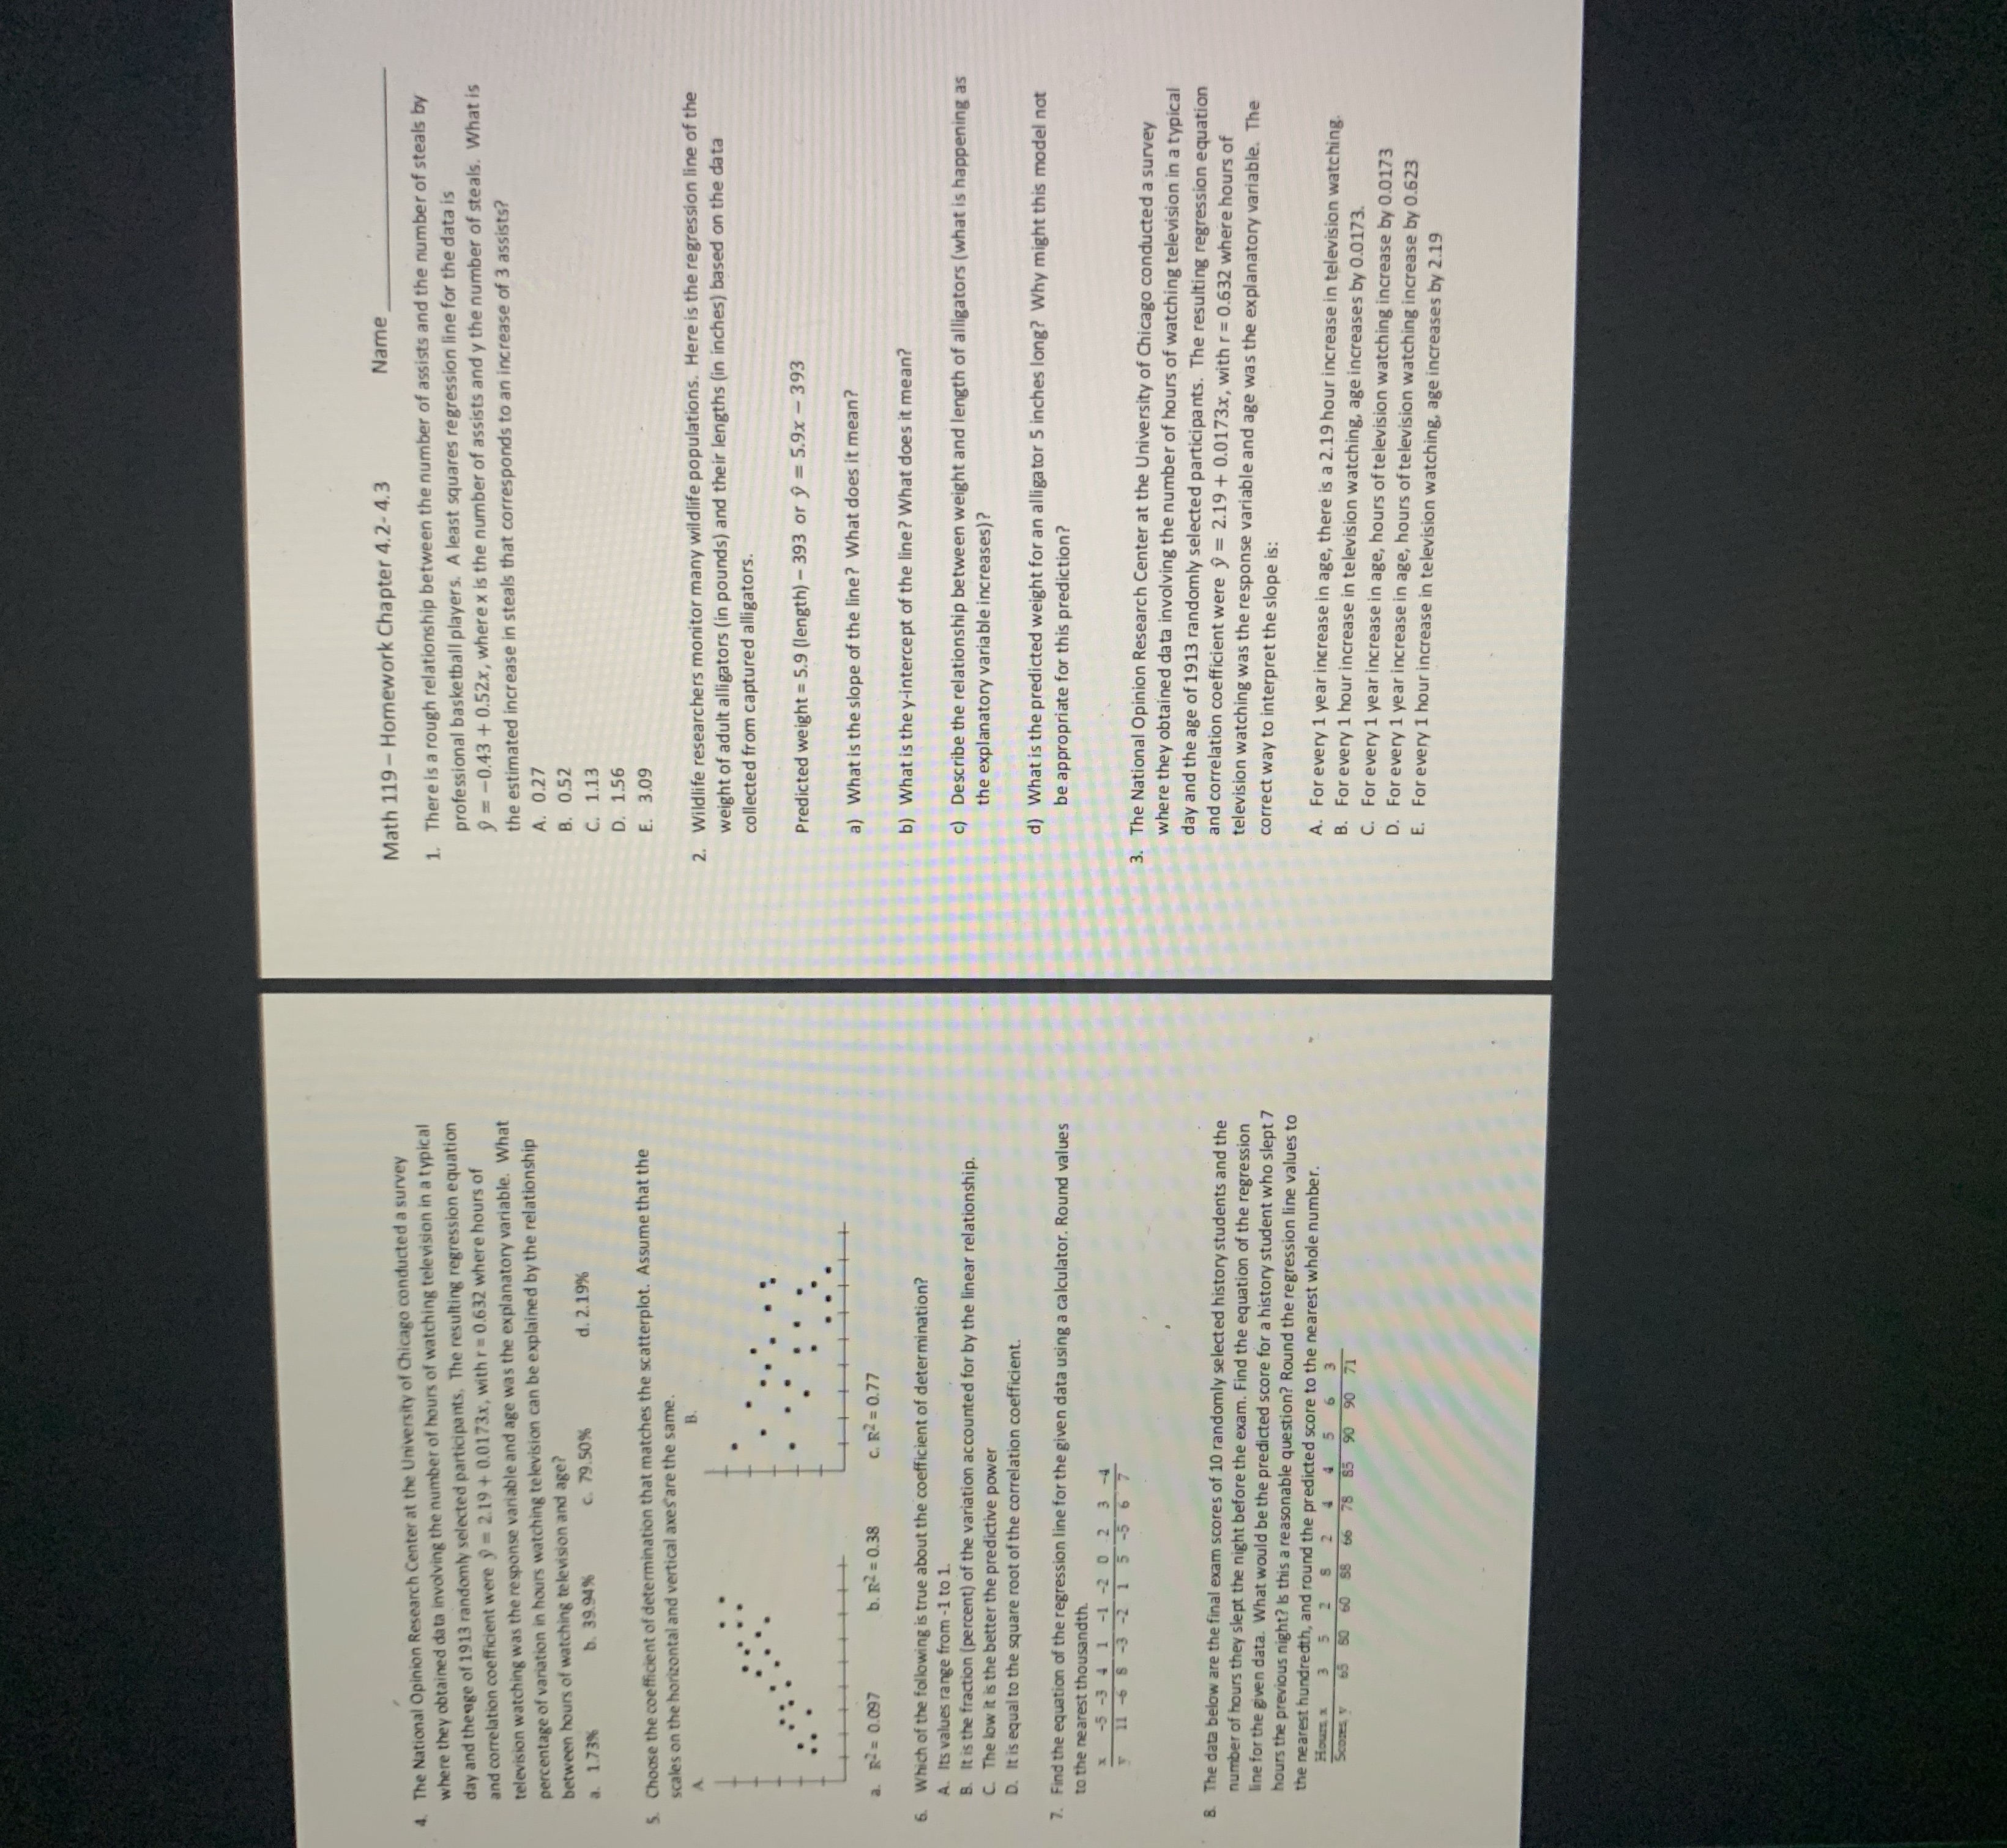
4. The National Opinion Research Center at the University of Chicago conducted a survey Math 119- Homework Chapter 4.2- 4.3 Name_ where they obtained data involving the number of hours of watching television in a typical There is a rough relationship between the number of assists and the number of steals by day and theage of 1913 randomly selected participants, The resulting regression equation and correlation coefficient were ) = 2.19 + 0.0173x, with r = 0.632 where hours of professional basketball players. A least squares regression line for the data is television watching was the response variable and age was the explanatory variable. What " = -0.43 + 0.52x, where x is the number of assists and y the number of steals. What is percentage of variation in hours watching television can be explained by the relationship the estimated increase in steals that corresponds to an increase of 3 assists? between hours of watching television and age? A. 0.27 a. 1.73% b. 39.94% C. 79.50% d. 2.19% B. 0.52 C. 1.13 D. 1.56 5. Choose the coefficient of determination that matches the scatterplot. Assume that the scales on the horizontal and vertical axes are the same. 3.09 A B. 2. Wildlife researchers monitor many wildlife populations. Here is the regression line of the weight of adult alligators (in pounds) and their lengths (in inches) based on the data collected from captured alligators. Predicted weight = 5.9 (length) - 393 or y = 5.9x - 393 a. R- = 0.097 b. R2 = 0.38 C. R2 = 0.77 a) What is the slope of the line? What does it mean? Which of the following is true about the coefficient of determination? b) What is the y-intercept of the line ? What does it mean? A. Its values range from -1 to 1. B. It is the fraction (percent) of the variation accounted for by the linear relationship C. The low it is the better the predictive power c) Describe the relationship between weight and length of alligators (what is happening as the explanatory variable increases)? D. It is equal to the square root of the correlation coefficient 7. Find the equation of the regression line for the given data using a calculator. Round values "d) What is the predicted weight for an alligator 5 inches long? Why might this model not to the nearest thousandth. be appropriate for this prediction? x -5 -3 4 1 -1 -2 0 2 7 11 6 8 - 3 - 2 1 5 -5 5 3. The National Opinion Research Center at the University of Chicago conducted a survey where they obtained data involving the number of hours of watching television in a typical 8. The data below are the final exam scores of 10 randomly selected history students and th day and the age of 1913 randomly selected participants. The resulting regression equation number of hours they slept the night before the exam. Find the equation of the regression and correlation coefficient were y = 2.19 + 0.0173x, with r = 0.632 where hours of line for the given data. What would be the predicted score for a history student who slept 7 television watching was the response variable and age was the explanatory variable. The hours the previous night? Is this a reasonable question? Round the regression line values to correct way to interpret the slope is: the nearest hundredth, and round the predicted score to the nearest whole number. Hours x 3 5 Scores y 65 80 60 58 66 75 85 90 90 71 A. For every 1 year increase in age, there is a 2.19 hour increase in television watching B. For every 1 hour increase in television watching, age increases by 0.0173. C. For every 1 year increase in age, hours of television watching increase by 0.0173 D. For every 1 year increase in age, hours of television watching increase by 0.623 E. For every 1 hour increase in television watching, age increases by 2.19


