please explain risk analysis and risk treatment plan as well. base on Australian firm

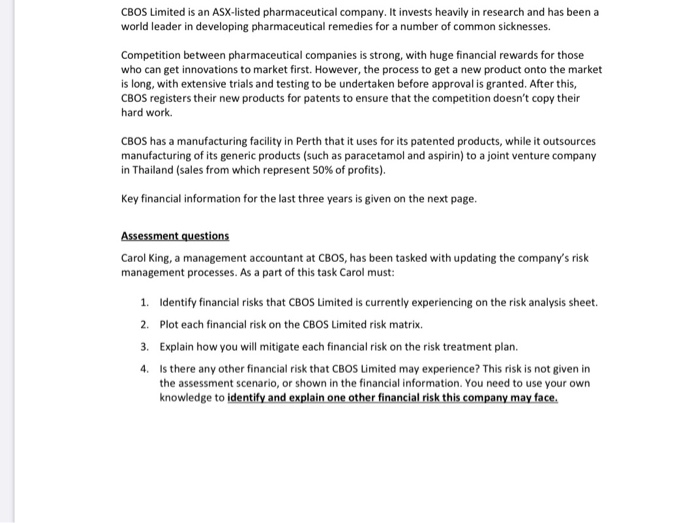
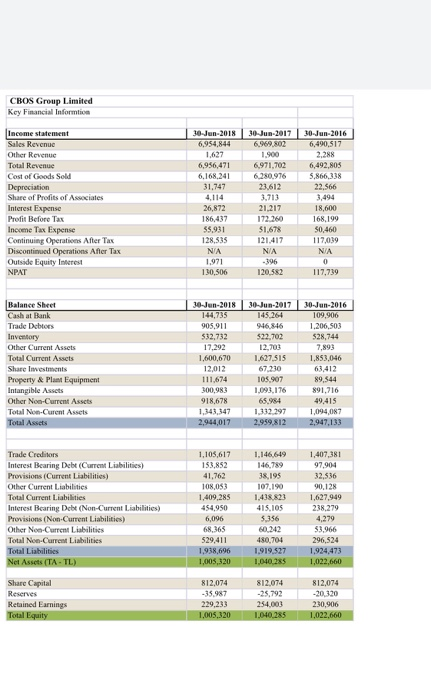
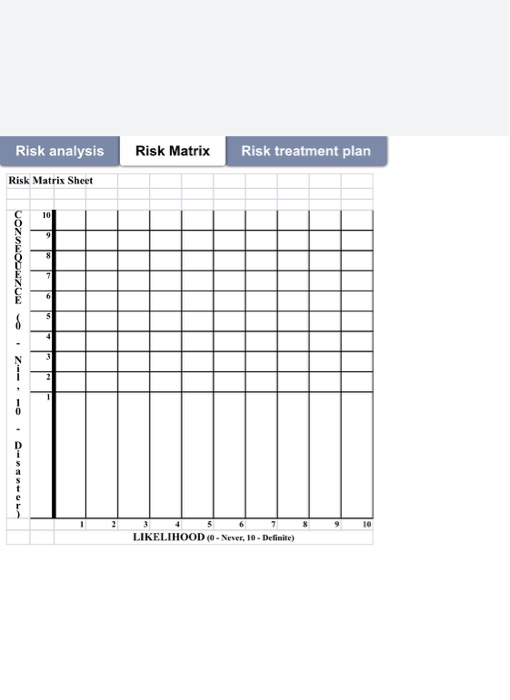
CBOS Limited is an Asx-listed pharmaceutical company. It invests heavily in research and has been a world leader in developing pharmaceutical remedies for a number of common sicknesses. Competition between pharmaceutical companies is strong, with huge financial rewards for those who can get innovations to market first. However, the process to get a new product onto the market is long, with extensive trials and testing to be undertaken before approval is granted. After this, CBOS registers their new products for patents to ensure that the competition doesn't copy their hard work CBOS has a manufacturing facility in Perth that it uses for its patented products, while it outsources manufacturing of its generic products (such as paracetamol and aspirin) to a joint venture company in Thailand (sales from which represent 50% of profits). Key financial information for the last three years is given on the next page. Assessment questions Carol King, a management accountant at CBOS, has been tasked with updating the company's risk management processes. As a part of this task Carol must: 1. Identify financial risks that CBOS Limited is currently experiencing on the risk analysis sheet. 2. Plot each financial risk on the CBOS Limited risk matrix. 3. Explain how you will mitigate each financial risk on the risk treatment plan. 4. Is there any other financial risk that CBOS Limited may experience? This risk is not given in the assessment scenario, or shown in the financial information. You need to use your own knowledge to identify and explain one other financial risk this company may face. CBOS Group Limited Key Financial Informtion 30-Jun-2017 30-Jun-2016 6,490,517 2.288 6,492,805 5,866,338 22.566 Income statement Sales Revenue Other Revenue Total Revenue Cost of Goods Sold Depreciation Share of Profits of Associates Interest Expense Profit Before Tax Income Tax Expense Continuing Operations After Tax Discontinued Operations After Tax Outside Equity Interest NPAT 30-Jun-2018 6,954,844 1.627 6,956,471 6,168,241 31,747 4,114 26,872 186,437 55.931 128,535 NA 1.971 130,506 1.900 6,971.702 6.280,976 23.612 3.713 21.217 172.260 $1.678 121.417 NA -396 120,582 18,600 168,199 50,460 117,039 NA 0 117,739 Balance Sheet Cash at Bank Trade Debtors Inventory Other Current Assets Total Current Assets Share Investments Property & Plant Equipment Intangible Assets Other Non-Current Assets Total Non-Curent Assets Total Assets 30-Jun-2018 144,735 905,911 532,732 17,292 1,600,670 12,012 111,674 300,983 918,678 1,348,347 2,944,017 30-Jun-2017 145.264 946.846 $22,702 12,703 1.627,515 67.230 105.907 1,093,176 65.984 1.332.197 2.959.812 30-Jun-2016 109,906 1,206,503 528,744 7,893 1,853,046 63,412 89,544 891,716 49.415 1,094,087 2,947,133 1,146,649 146,789 38,195 107.190 Trade Creditors Interest Bearing Debt Current Liabilities) Provisions (Current Liabilities) Other Current Liabilities Total Current Liabilities Interest Bearing Debt (Non-Current Liabilities) Provisions (Non-Current Liabilities) Other Non-Current Liabilities Total Non-Current Liabilities Total Liabilities Net Assets (TA-TL) 1,105,617 153,852 41,762 108,053 1,409,285 454,950 6,096 68.365 529,411 1,938,696 1,005,320 415,105 5356 1,407,381 97,904 32,536 90.128 1,627,949 238.279 4.279 $3.966 296,524 1.924,473 1,022,660 480,704 1,919,527 1.040.285 Share Capital Reserves Retained Earnings Total Equity 812,074 -35.987 229,233 1,005,320 812.074 -25,792 254,003 1,040,285 812,074 -20,320 230,906 1,022,660 Risk Matrix Risk treatment plan Risk analysis Risk Matrix Sheet 10 .-.--Z. Z Ozon 10 LIKELIHOOD (0- Never, 10 - Definite) CBOS Limited is an Asx-listed pharmaceutical company. It invests heavily in research and has been a world leader in developing pharmaceutical remedies for a number of common sicknesses. Competition between pharmaceutical companies is strong, with huge financial rewards for those who can get innovations to market first. However, the process to get a new product onto the market is long, with extensive trials and testing to be undertaken before approval is granted. After this, CBOS registers their new products for patents to ensure that the competition doesn't copy their hard work CBOS has a manufacturing facility in Perth that it uses for its patented products, while it outsources manufacturing of its generic products (such as paracetamol and aspirin) to a joint venture company in Thailand (sales from which represent 50% of profits). Key financial information for the last three years is given on the next page. Assessment questions Carol King, a management accountant at CBOS, has been tasked with updating the company's risk management processes. As a part of this task Carol must: 1. Identify financial risks that CBOS Limited is currently experiencing on the risk analysis sheet. 2. Plot each financial risk on the CBOS Limited risk matrix. 3. Explain how you will mitigate each financial risk on the risk treatment plan. 4. Is there any other financial risk that CBOS Limited may experience? This risk is not given in the assessment scenario, or shown in the financial information. You need to use your own knowledge to identify and explain one other financial risk this company may face. CBOS Group Limited Key Financial Informtion 30-Jun-2017 30-Jun-2016 6,490,517 2.288 6,492,805 5,866,338 22.566 Income statement Sales Revenue Other Revenue Total Revenue Cost of Goods Sold Depreciation Share of Profits of Associates Interest Expense Profit Before Tax Income Tax Expense Continuing Operations After Tax Discontinued Operations After Tax Outside Equity Interest NPAT 30-Jun-2018 6,954,844 1.627 6,956,471 6,168,241 31,747 4,114 26,872 186,437 55.931 128,535 NA 1.971 130,506 1.900 6,971.702 6.280,976 23.612 3.713 21.217 172.260 $1.678 121.417 NA -396 120,582 18,600 168,199 50,460 117,039 NA 0 117,739 Balance Sheet Cash at Bank Trade Debtors Inventory Other Current Assets Total Current Assets Share Investments Property & Plant Equipment Intangible Assets Other Non-Current Assets Total Non-Curent Assets Total Assets 30-Jun-2018 144,735 905,911 532,732 17,292 1,600,670 12,012 111,674 300,983 918,678 1,348,347 2,944,017 30-Jun-2017 145.264 946.846 $22,702 12,703 1.627,515 67.230 105.907 1,093,176 65.984 1.332.197 2.959.812 30-Jun-2016 109,906 1,206,503 528,744 7,893 1,853,046 63,412 89,544 891,716 49.415 1,094,087 2,947,133 1,146,649 146,789 38,195 107.190 Trade Creditors Interest Bearing Debt Current Liabilities) Provisions (Current Liabilities) Other Current Liabilities Total Current Liabilities Interest Bearing Debt (Non-Current Liabilities) Provisions (Non-Current Liabilities) Other Non-Current Liabilities Total Non-Current Liabilities Total Liabilities Net Assets (TA-TL) 1,105,617 153,852 41,762 108,053 1,409,285 454,950 6,096 68.365 529,411 1,938,696 1,005,320 415,105 5356 1,407,381 97,904 32,536 90.128 1,627,949 238.279 4.279 $3.966 296,524 1.924,473 1,022,660 480,704 1,919,527 1.040.285 Share Capital Reserves Retained Earnings Total Equity 812,074 -35.987 229,233 1,005,320 812.074 -25,792 254,003 1,040,285 812,074 -20,320 230,906 1,022,660 Risk Matrix Risk treatment plan Risk analysis Risk Matrix Sheet 10 .-.--Z. Z Ozon 10 LIKELIHOOD (0- Never, 10 - Definite)


