Answered step by step
Verified Expert Solution
Link Copied!

Question

1 Approved Answer

Please explain the company valuations from this data and describe the situation of the company valuations. 2016 2017 2018 2019 2020 2021 Jitta.com EN V

Please explain the company valuations from this data and describe the situation of the company valuations.
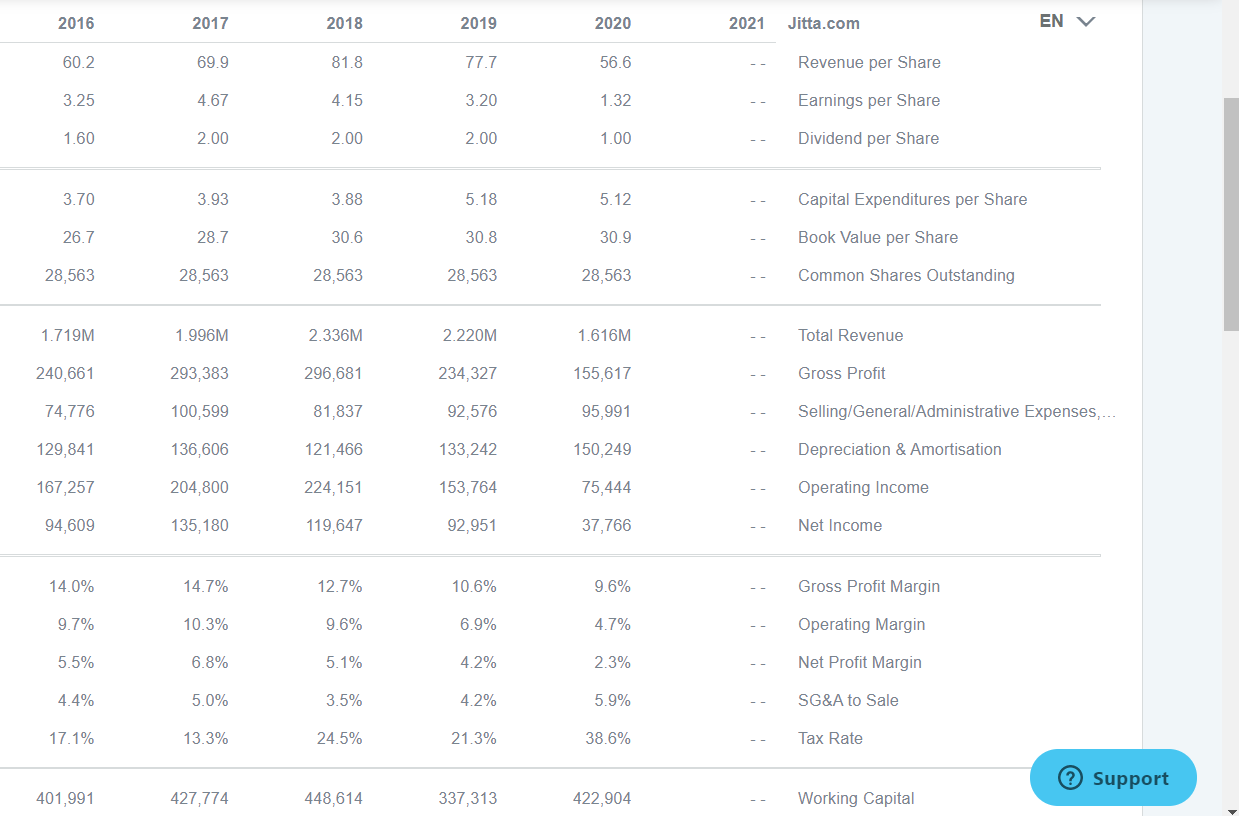
image text in transcribed

2016 2017 2018 2019 2020 2021 Jitta.com EN V 60.2 69.9 81.8 77.7 56.6 Revenue per Share 3.25 4.67 4.15 3.20 1.32 Earnings per Share 1.60 2.00 2.00 2.00 1.00 Dividend per Share 3.70 3.93 3.88 5.18 5.12 Capital Expenditures per Share 26.7 28.7 30.6 30.8 30.9 Book Value per Share 28,563 28,563 28,563 28,563 28,563 Common Shares Outstanding 1.719M 1.996M 2.336M 2.220M 1.616M Total Revenue 240,661 293,383 296,681 234,327 155,617 Gross Profit 74,776 100,599 81,837 92,576 95,991 Selling/General/Administrative Expenses,... 129,841 136,606 121,466 133.242 150,249 Depreciation & Amortisation 167,257 204,800 224,151 153,764 75,444 Operating Income 94,609 135,180 119,647 92,951 37,766 Net Income 14.0% 14.7% 12.7% 10.6% 9.6% Gross Profit Margin 9.7% 10.3% 9.6% 6.9% 4.7% Operating Margin 5.5% 6.8% 5.1% 4.2% 2.3% Net Profit Margin 4.4% 5.0% 3.5% 4.2% 5.9% SG&A to Sale 17.1% 13.3% 24.5% 21.3% 38.6% Tax Rate Support 401,991 427,774 448,614 337,313 422,904 Working Capital 2016 2017 2018 2019 2020 2021 Jitta.com EN V 60.2 69.9 81.8 77.7 56.6 Revenue per Share 3.25 4.67 4.15 3.20 1.32 Earnings per Share 1.60 2.00 2.00 2.00 1.00 Dividend per Share 3.70 3.93 3.88 5.18 5.12 Capital Expenditures per Share 26.7 28.7 30.6 30.8 30.9 Book Value per Share 28,563 28,563 28,563 28,563 28,563 Common Shares Outstanding 1.719M 1.996M 2.336M 2.220M 1.616M Total Revenue 240,661 293,383 296,681 234,327 155,617 Gross Profit 74,776 100,599 81,837 92,576 95,991 Selling/General/Administrative Expenses,... 129,841 136,606 121,466 133.242 150,249 Depreciation & Amortisation 167,257 204,800 224,151 153,764 75,444 Operating Income 94,609 135,180 119,647 92,951 37,766 Net Income 14.0% 14.7% 12.7% 10.6% 9.6% Gross Profit Margin 9.7% 10.3% 9.6% 6.9% 4.7% Operating Margin 5.5% 6.8% 5.1% 4.2% 2.3% Net Profit Margin 4.4% 5.0% 3.5% 4.2% 5.9% SG&A to Sale 17.1% 13.3% 24.5% 21.3% 38.6% Tax Rate Support 401,991 427,774 448,614 337,313 422,904 Working Capital

Step by Step Solution

There are 3 Steps involved in it

Step: 1

blur-text-image

Get Instant Access to Expert-Tailored Solutions

See step-by-step solutions with expert insights and AI powered tools for academic success

Step: 2

blur-text-image_2

Step: 3

blur-text-image_3

Ace Your Homework with AI

Get the answers you need in no time with our AI-driven, step-by-step assistance

Get Started

Recommended Textbook for

Executive Finance And Strategy

Authors: Ralph Tiffin

1st Edition

0749471506, 978-0749471507

More Books

Students also viewed these Finance questions