Answered step by step
Verified Expert Solution
Link Copied!

Question

1 Approved Answer

Please, explain this 2 graph for theUnited States. Provide the cite where you got the information as well. Libor 0.095 0.09 0.085 0.08 0.075 0.07
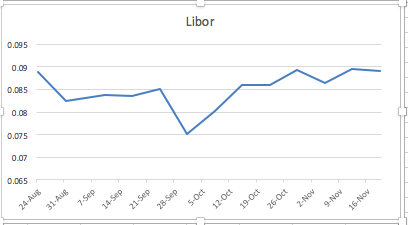
Please, explain this 2 graph for theUnited States.

Provide the cite where you got the information as well.
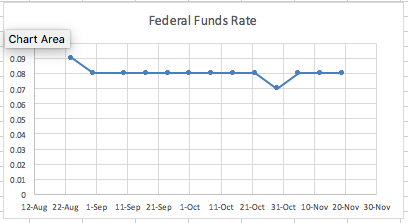
image text in transcribed

image text in transcribed

Libor 0.095 0.09 0.085 0.08 0.075 0.07 0.065 19-Oct 12-Oct 26-Oct 2. Nov 24-Aug 31-Aug 7-Sep 9-Noy 16-Nov 14-Sep 21-Sep 26-Sep 5 Oct Federal Funds Rate Chart Area 0.09 0.08 0.07 0.06 0.05 0.04 0.03 0.02 0.01 0 12-Aug 22-Aug 1-Sep 11-Sep 21-Sep 1-Oct 11-Oct 21-Oct 31-Oct 10-Nov 20-Nov 30-Nov Libor 0.095 0.09 0.085 0.08 0.075 0.07 0.065 19-Oct 12-Oct 26-Oct 2. Nov 24-Aug 31-Aug 7-Sep 9-Noy 16-Nov 14-Sep 21-Sep 26-Sep 5 Oct Federal Funds Rate Chart Area 0.09 0.08 0.07 0.06 0.05 0.04 0.03 0.02 0.01 0 12-Aug 22-Aug 1-Sep 11-Sep 21-Sep 1-Oct 11-Oct 21-Oct 31-Oct 10-Nov 20-Nov 30-Nov

Step by Step Solution

There are 3 Steps involved in it

Step: 1

blur-text-image

Get Instant Access to Expert-Tailored Solutions

See step-by-step solutions with expert insights and AI powered tools for academic success

Step: 2

blur-text-image

Step: 3

blur-text-image

Ace Your Homework with AI

Get the answers you need in no time with our AI-driven, step-by-step assistance

Get Started

Recommended Textbook for

Trade Union Finance

Authors: Marick F. Masters, Raymond Gibney

1st Edition

1032371382, 978-1032371382

More Books

Students also viewed these Finance questions