Please fill out all of the blank boxes using formulas. Proforma Forecast
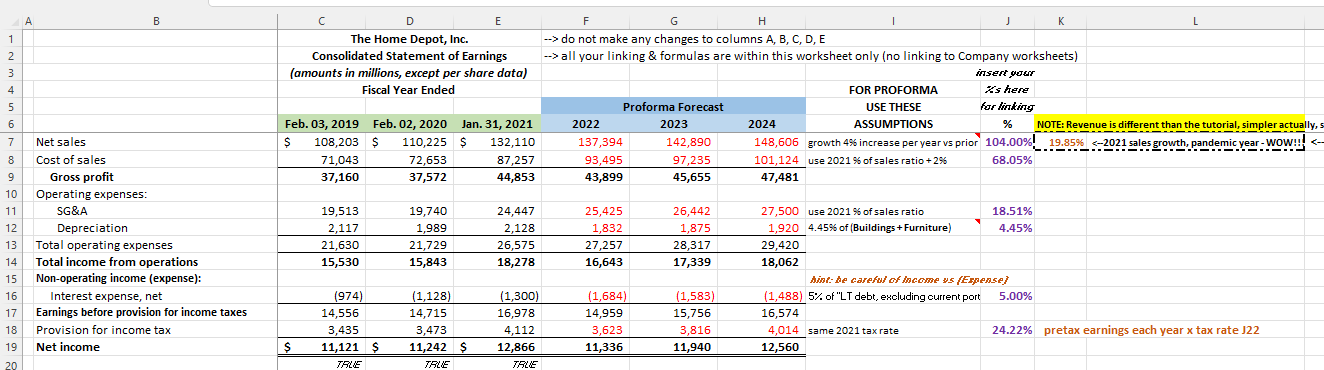
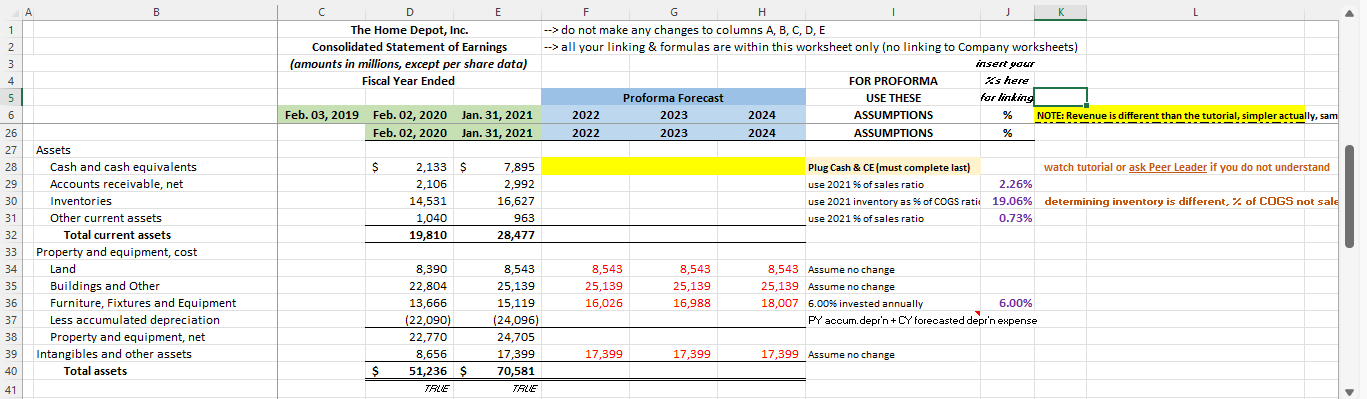
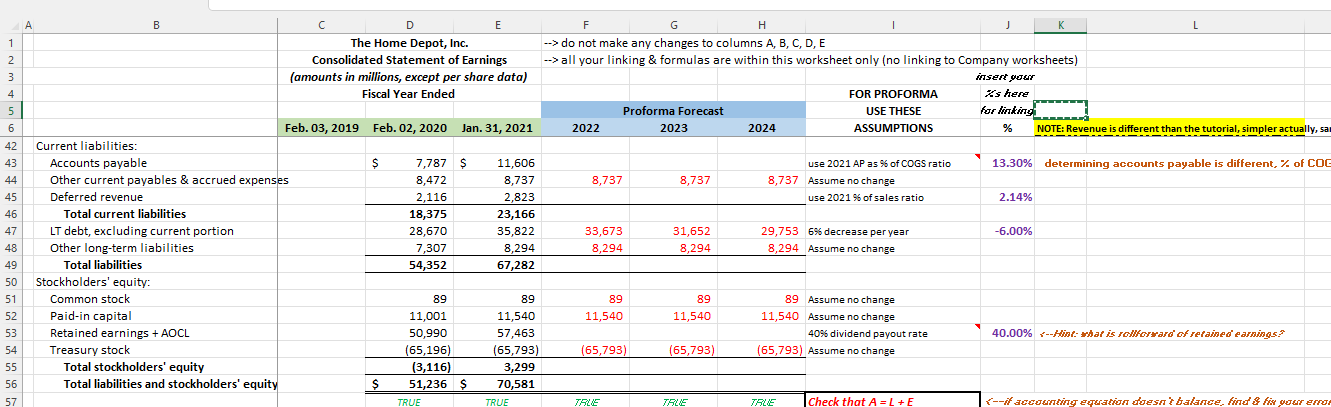
B 1 2 3 D E The Home Depot, Inc. Consolidated Statement of Earnings (amounts in millions, except per share data) Fiscal Year Ended 4 F G H K L --> do not make any changes to columns A, B, C, D, E --> all your linking & formulas are within this worksheet only (no linking to Company worksheets) insert your FOR PROFORMA is here Proforma Forecast USE THESE for linking 2022 2023 2024 ASSUMPTIONS % NOTE: Revenue is different than the tutorial, simpler actually, ---- 137,394 142,890 148,606 growth 4% increase per year vs prior 104.00%! 19.85% do not make any changes to columns A, B, C, D, E --> all your linking & formulas are within this worksheet only (no linking to Company worksheets) insert your FOR PROFORMA is here Proforma Forecast USE THESE for linking 2022 2023 2024 ASSUMPTIONS % NOTE: Revenue is different than the tutorial, simpler actually, sam ---- 2022 2023 2024 ASSUMPTIONS % Feb. 03, 2019 Feb. 02, 2020 Jan. 31, 2021 Feb. 02, 2020 Jan. 31, 2021 $ 2 2 3 4 5 5 6 26 27 28 29 30 31 32 33 34 35 36 37 38 39 40 2,133 $ 2,106 14,531 1,040 19,810 7,895 2,992 16,627 963 28,477 Plug Cash & CE (must complete last) watch tutorial or ask Peer Leader if you do not understand use 2021 % of sales ratio 2.26% use 2021 inventory as % of COGS rati 19.06% determining inventory is different, % of COGS not sale use 2021 % of sales ratio 0.73% Assets Cash and cash equivalents Accounts receivable, net Inventories Other current assets Total current assets Property and equipment, cost Land Buildings and Other Furniture, Fixtures and Equipment Less accumulated depreciation Property and equipment, net Intangibles and other assets Total assets 8,543 25,139 16,026 8,543 25,139 16,988 8,543 Assume no change 25,139 Assume no change 18,007 6.00% invested annually 6.00% PY accum.depr'n + CY forecasted deprin expense 8,390 22,804 13,666 (22,090) 22,770 8,656 51,236 $ TALE 8,543 25,139 15,119 (24,096) 24,705 17,399 70,581 TALE 17,399 17,399 17,399 Assume no change $ 41 . B 1 1 2 2 3 C E The Home Depot, Inc. Consolidated Statement of Earnings (amounts in millions, except per share data) Fiscal Year Ended F G H K L --> do not make any changes to columns A, B, C, D, E --> all your linking & formulas are within this worksheet only (no linking to Company worksheets) insert your FOR PROFORMA i's here Proforma Forecast USE THESE 2022 2023 2024 ASSUMPTIONS % NOTE: Revenue is different than the tutorial, simpler actually, sa for linkine --- 4 5 5 6 42 43 13.30% determining accounts payable is different, % of COG 44 8,737 8,737 use 2021 AP as % of COGS ratio 8,737 Assume no change use 2021 % of sales ratio 2.14% -6.00% 33,673 8,294 31,652 8,294 29,753 6% decrease per year 8,294 Assume no change 45 46 47 48 49 50 51 52 Feb. 03, 2019 Feb. 02, 2020 Jan. 31, 2021 Current liabilities: Accounts payable $ 7,787 $ 11,606 Other current payables & accrued expenses 8,472 8,737 Deferred revenue 2,116 2,823 Total current liabilities 18,375 23,166 LT debt, excluding current portion 28,670 35,822 Other long-term liabilities 7,307 8,294 Total liabilities 54,352 67,282 Stockholders' equity: Common stock 89 89 Paid-in capital - 11,001 11,540 Retained earnings + AOCL + 50,990 57,463 Treasury stock (65,196) (65,793) Total stockholders' equity (3,116) 3,299 Total liabilities and stockholders' equity $ 51,236 $ 70,581 TRUE TRUE 89 11,540 89 11,540 89 Assume no change 11,540 Assume no change 40% dividend payout rate (65,793) Assume no change 40.00% Hint war is rollforward' of retained' earnings (65,793) (65,793) 53 54 55 56 57 TALE TALE TRUE Check that A=L+E do not make any changes to columns A, B, C, D, E --> all your linking & formulas are within this worksheet only (no linking to Company worksheets) insert your FOR PROFORMA is here Proforma Forecast USE THESE for linking 2022 2023 2024 ASSUMPTIONS % NOTE: Revenue is different than the tutorial, simpler actually, ---- 137,394 142,890 148,606 growth 4% increase per year vs prior 104.00%! 19.85% do not make any changes to columns A, B, C, D, E --> all your linking & formulas are within this worksheet only (no linking to Company worksheets) insert your FOR PROFORMA is here Proforma Forecast USE THESE for linking 2022 2023 2024 ASSUMPTIONS % NOTE: Revenue is different than the tutorial, simpler actually, sam ---- 2022 2023 2024 ASSUMPTIONS % Feb. 03, 2019 Feb. 02, 2020 Jan. 31, 2021 Feb. 02, 2020 Jan. 31, 2021 $ 2 2 3 4 5 5 6 26 27 28 29 30 31 32 33 34 35 36 37 38 39 40 2,133 $ 2,106 14,531 1,040 19,810 7,895 2,992 16,627 963 28,477 Plug Cash & CE (must complete last) watch tutorial or ask Peer Leader if you do not understand use 2021 % of sales ratio 2.26% use 2021 inventory as % of COGS rati 19.06% determining inventory is different, % of COGS not sale use 2021 % of sales ratio 0.73% Assets Cash and cash equivalents Accounts receivable, net Inventories Other current assets Total current assets Property and equipment, cost Land Buildings and Other Furniture, Fixtures and Equipment Less accumulated depreciation Property and equipment, net Intangibles and other assets Total assets 8,543 25,139 16,026 8,543 25,139 16,988 8,543 Assume no change 25,139 Assume no change 18,007 6.00% invested annually 6.00% PY accum.depr'n + CY forecasted deprin expense 8,390 22,804 13,666 (22,090) 22,770 8,656 51,236 $ TALE 8,543 25,139 15,119 (24,096) 24,705 17,399 70,581 TALE 17,399 17,399 17,399 Assume no change $ 41 . B 1 1 2 2 3 C E The Home Depot, Inc. Consolidated Statement of Earnings (amounts in millions, except per share data) Fiscal Year Ended F G H K L --> do not make any changes to columns A, B, C, D, E --> all your linking & formulas are within this worksheet only (no linking to Company worksheets) insert your FOR PROFORMA i's here Proforma Forecast USE THESE 2022 2023 2024 ASSUMPTIONS % NOTE: Revenue is different than the tutorial, simpler actually, sa for linkine --- 4 5 5 6 42 43 13.30% determining accounts payable is different, % of COG 44 8,737 8,737 use 2021 AP as % of COGS ratio 8,737 Assume no change use 2021 % of sales ratio 2.14% -6.00% 33,673 8,294 31,652 8,294 29,753 6% decrease per year 8,294 Assume no change 45 46 47 48 49 50 51 52 Feb. 03, 2019 Feb. 02, 2020 Jan. 31, 2021 Current liabilities: Accounts payable $ 7,787 $ 11,606 Other current payables & accrued expenses 8,472 8,737 Deferred revenue 2,116 2,823 Total current liabilities 18,375 23,166 LT debt, excluding current portion 28,670 35,822 Other long-term liabilities 7,307 8,294 Total liabilities 54,352 67,282 Stockholders' equity: Common stock 89 89 Paid-in capital - 11,001 11,540 Retained earnings + AOCL + 50,990 57,463 Treasury stock (65,196) (65,793) Total stockholders' equity (3,116) 3,299 Total liabilities and stockholders' equity $ 51,236 $ 70,581 TRUE TRUE 89 11,540 89 11,540 89 Assume no change 11,540 Assume no change 40% dividend payout rate (65,793) Assume no change 40.00% Hint war is rollforward' of retained' earnings (65,793) (65,793) 53 54 55 56 57 TALE TALE TRUE Check that A=L+E