Answered step by step
Verified Expert Solution
Question
1 Approved Answer
Please generate a histogram and a horizontal boxplot to show the distribution of Severity. For the histogram, use a bin-width of $500 and put

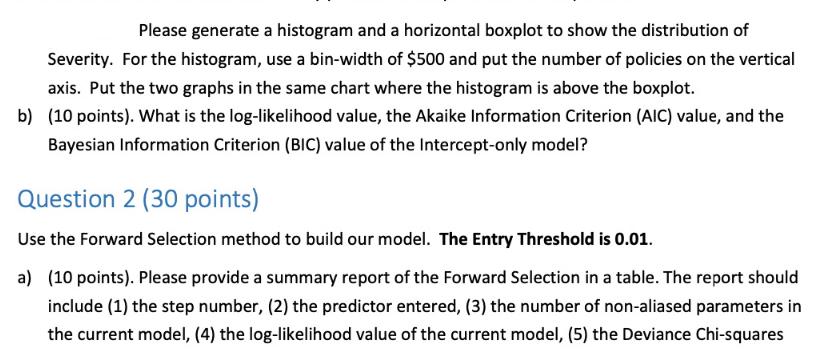
Please generate a histogram and a horizontal boxplot to show the distribution of Severity. For the histogram, use a bin-width of $500 and put the number of policies on the vertical axis. Put the two graphs in the same chart where the histogram is above the boxplot. b) (10 points). What is the log-likelihood value, the Akaike Information Criterion (AIC) value, and the Bayesian Information Criterion (BIC) value of the Intercept-only model? Question 2 (30 points) Use the Forward Selection method to build our model. The Entry Threshold is 0.01. a) (10 points). Please provide a summary report of the Forward Selection in a table. The report should include (1) the step number, (2) the predictor entered, (3) the number of non-aliased parameters in the current model, (4) the log-likelihood value of the current model, (5) the Deviance Chi-squares
Step by Step Solution
★★★★★
3.48 Rating (148 Votes )
There are 3 Steps involved in it
Step: 1
I can help you create a histogram and a horizontal boxplot for the distribution of Severity but Im u...
Get Instant Access to Expert-Tailored Solutions
See step-by-step solutions with expert insights and AI powered tools for academic success
Step: 2

Step: 3

Ace Your Homework with AI
Get the answers you need in no time with our AI-driven, step-by-step assistance
Get Started


