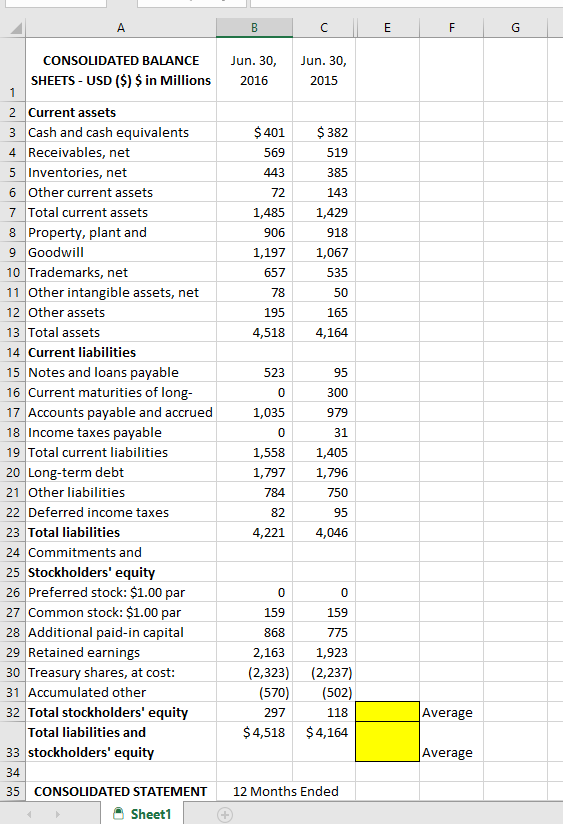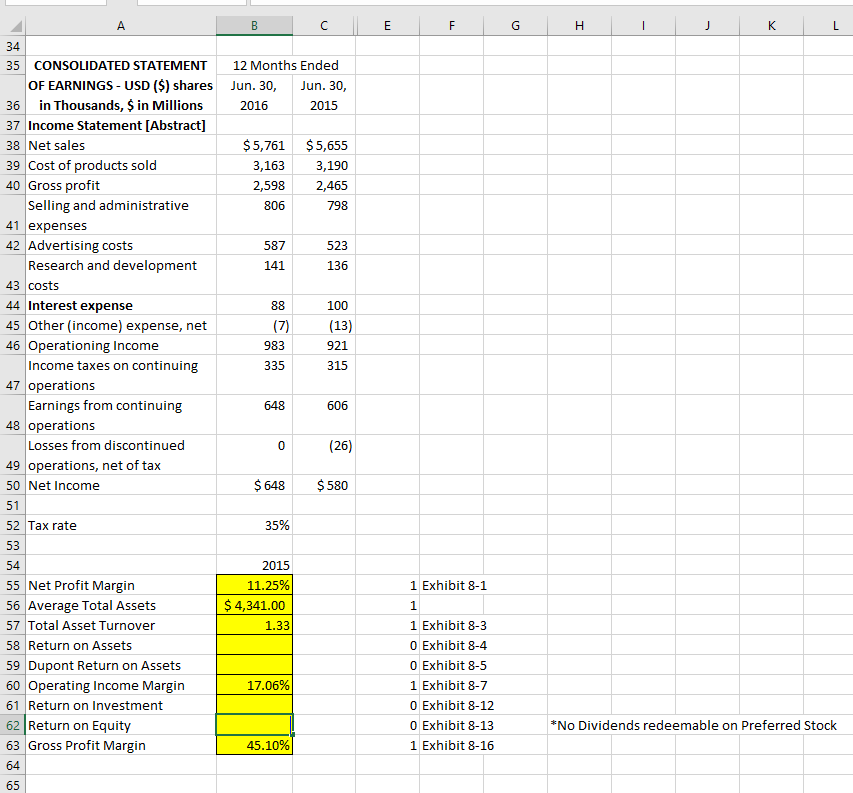
 Please give formula used with numbers and cell reference (example: b15/b19) to help me understand. Thank you
A B F G CONSOLIDATED BALANCE SHEETS- USD ($) $ in Millions Jun. 30, 2016 Jun. 30, 2015 $ 401 569 443 72 $382 519 385 143 1,429 918 1,067 535 1,485 906 1,197 657 78 50 195 165 4,164 4,518 523 95 0 300 2 Current assets 3 Cash and cash equivalents 4 Receivables, net 5 Inventories, net 6 Other current assets 7 Total current assets 8 Property, plant and 9 Goodwill 10 Trademarks, net 11 Other intangible assets, net 12 Other assets 13 Total assets 14 Current liabilities 15 Notes and loans payable 16 Current maturities of long- 17 Accounts payable and accrued 18 Income taxes payable 19 Total current liabilities 20 Long-term debt 21 Other liabilities 22 Deferred income taxes 23 Total liabilities 24 Commitments and 25 Stockholders' equity 26 Preferred stock: $1.00 par 27 Common stock: $1.00 par 28 Additional paid-in capital 29 Retained earnings 30 Treasury shares, at cost: 31 Accumulated other 32 Total stockholders' equity Total liabilities and 33 stockholders' equity 34 35 CONSOLIDATED STATEMENT Sheet1 1,035 0 1,558 1,797 784 82 4,221 979 31 1,405 1,796 750 95 4,046 0 0 159 159 868 2,163 (2,323) (570) 297 $4,518 775 1,923 (2,237) (502) 118 $4,164 Average Average 12 Months Ended A B E F H j K L 12 Months Ended Jun. 30, Jun. 30, 2016 2015 $5,761 3,163 2,598 806 $ 5,655 3,190 2,465 798 587 523 34 35 CONSOLIDATED STATEMENT OF EARNINGS- USD ($) shares 36 in Thousands, $ in Millions 37 Income Statement [Abstract] 38 Net sales 39 Cost of products sold 40 Gross profit Selling and administrative 41 expenses 42 Advertising costs Research and development 43 costs 44 Interest expense 45 Other (income) expense, net 46 Operationing Income Income taxes on continuing 47 operations Earnings from continuing 48 operations Losses from discontinued 49 operations, net of tax 50 Net Income 141 136 88 (7) 983 335 100 (13) 921 315 648 606 0 (26) $ 648 $ 580 51 52 Tax rate 35% 53 2015 11.25% $ 4,341.00 1.33 54 55 Net Profit Margin 56 Average Total Assets 57 Total Asset Turnover 58 Return on Assets 59 Dupont Return on Assets 60 Operating Income Margin 61 Return on Investment 62 Return on Equity 63 Gross Profit Margin 64 1 Exhibit 8-1 1 1 Exhibit 8-3 O Exhibit 8-4 0 Exhibit 8-5 1 Exhibit 8-7 O Exhibit 8-12 O Exhibit 8-13 1 Exhibit 8-16 17.06% *No Dividends redeemable on Preferred Stock 45.10% 65

 Please give formula used with numbers and cell reference (example: b15/b19) to help me understand. Thank you


