

Answered step by step
Verified Expert Solution
Question
1 Approved Answer
please graph the following in excel H. Graphing the results of pH experiments in EXCEL. 1. Label a column for minutes, 0%H2O2,3%H2O2,6%H2O2, and 12%H2O2. 2.
please graph the following in excel
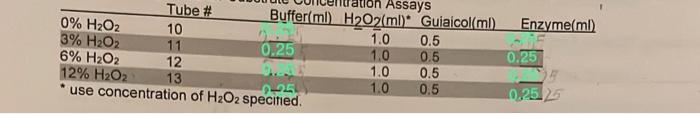
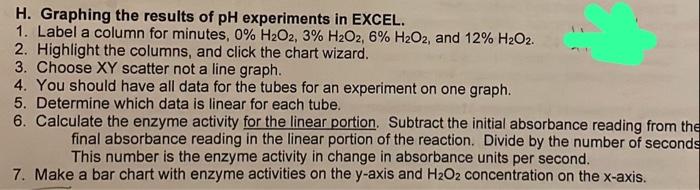
H. Graphing the results of pH experiments in EXCEL. 1. Label a column for minutes, 0%H2O2,3%H2O2,6%H2O2, and 12%H2O2. 2. Highlight the columns, and click the chart wizard. 3. Choose XY scatter not a line graph. 4. You should have all data for the tubes for an experiment on one graph. 5. Determine which data is linear for each tube. 6. Calculate the enzyme activity for the linear portion. Subtract the initial absorbance reading from th final absorbance reading in the linear portion of the reaction. Divide by the number of second This number is the enzyme activity in change in absorbance units per second. 7. Make a bar chart with enzyme activities on the y-axis and H2O2 concentration on the x-axis Step by Step Solution
There are 3 Steps involved in it
Step: 1

Get Instant Access to Expert-Tailored Solutions
See step-by-step solutions with expert insights and AI powered tools for academic success
Step: 2

Step: 3
Ace Your Homework with AI
Get the answers you need in no time with our AI-driven, step-by-step assistance
Get Started
Organic Chemistry
Authors: John E. McMurry
9th Edition
130570102X, 978-1305701021