Answered step by step
Verified Expert Solution
Question
1 Approved Answer
Please Help!! 10-10. As a simple test of whether stock prices move randomly, go to Yahoo! (http:// www.yahoo.com) and download a few weeks of daily


Please Help!!
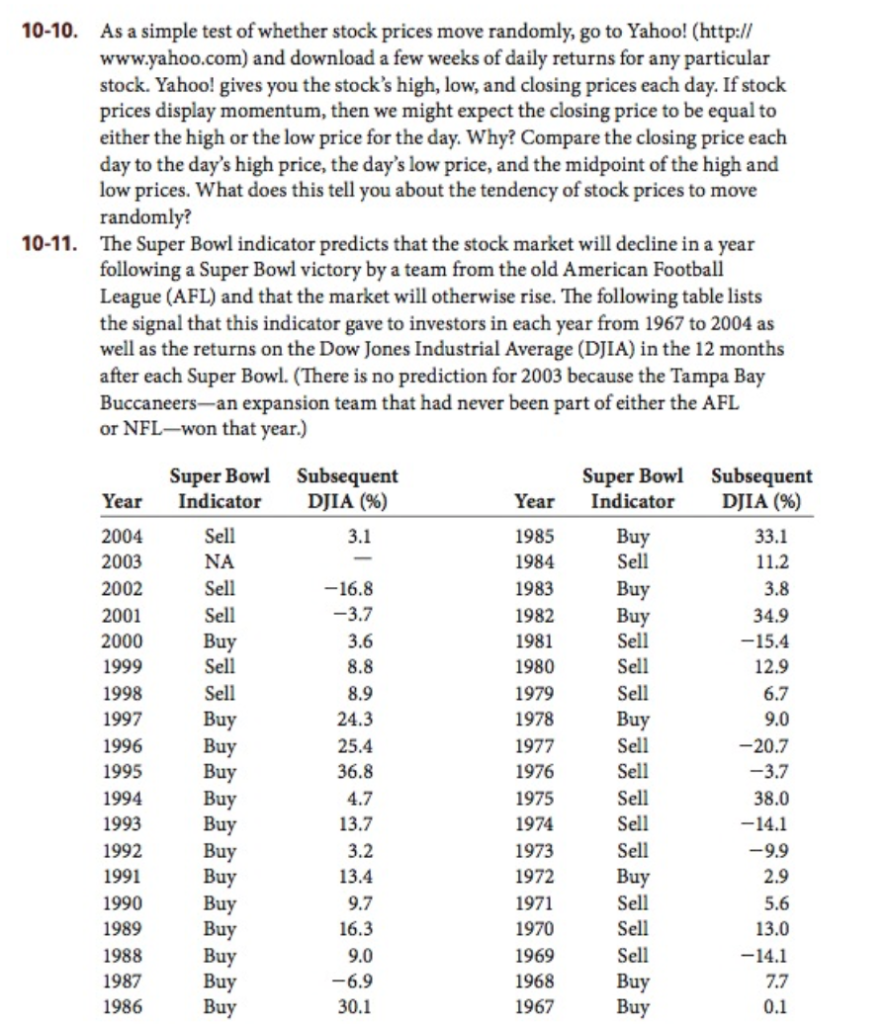
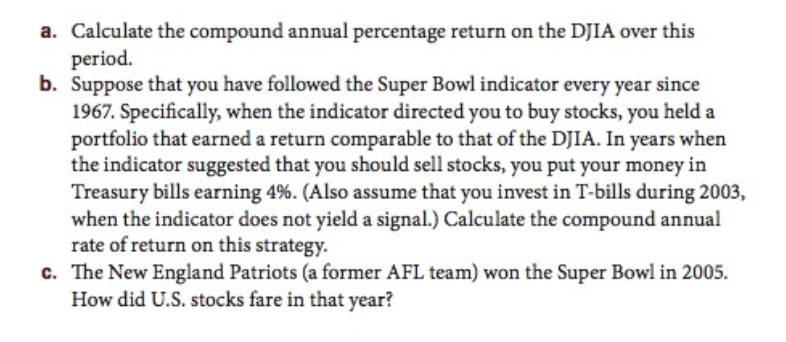
10-10. As a simple test of whether stock prices move randomly, go to Yahoo! (http:// www.yahoo.com) and download a few weeks of daily returns for any particular stock. Yahoo! gives you the stock's high, low, and closing prices each day. If stock prices display momentum, then we might expect the closing price to be equal to either the high or the low price for the day. Why? Compare the closing price each day to the day's high price, the day's low price, and the midpoint of the high and low prices. What does this tell you about the tendency of stock prices to move randomly? The Super Bowl indicator predicts that the stock market will decline in a year following a Super Bowl victory by a team from the old American Football League (AFL) and that the market will otherwise rise. The following table lists the signal that this indicator gave to investors in each year from 1967 to 2004 as well as the returns on the Dow Jones Industrial Average (DJIA) in the 12 months after each Super Bowl. (There is no prediction for 2003 because the Tampa Bay Buccaneers-an expansion team that had never been part of either the AFI or NFL-won that year.) 10-11. Super Bowl Subsequent Super Bowl Subsequent indicator indicator Sell NA DJIA (%) DJIA (96) Year 2004 2003 2002 2001 2000 1999 Year 1985 1984 1983 Sell Buy 33.1 11.2 16.8 34.9 15.4 12.9 6.7 9.0 -20.7 -3.7 Buy Sell Sell Sell 1998 Seli 1997 1996 1995 1994 1993 1992 1991 1990 1989 1988 1987 1979 1978 1977 1976 1975 1974 1973 1972 1971 1970 1969 1968 1967 24.3 25.4 36.8 4.7 13.7 uy uy uy uy uy Buy uy uy uy uy Buy uy Sell Sell Sell Sell Sell 38.0 14.1 9.9 13.4 Sell Sell Sell 16.3 13.0 14.1 7.7 0.1 30.1 a. Calculate the compound annual percentage return on the DJIA over this period. b. Suppose that you have followed the Super Bowl indicator every year since 1967. Specifically, when the indicator directed you to buy stocks, you held a portfolio that earned a return comparable to that of the DJIA. In years when the indicator suggested that you should sell stocks, you put your money in Treasury bills earning 4%. (Also assume that you invest in T-bills during 2003, when the indicator does not yield a signal.) Calculate the compound annual rate of return on this strategy. The New England Patriots (a former AFL team) won the Super Bowl in 2005. How did U.S. stocks fare in that year? c. 10-10. As a simple test of whether stock prices move randomly, go to Yahoo! (http:// www.yahoo.com) and download a few weeks of daily returns for any particular stock. Yahoo! gives you the stock's high, low, and closing prices each day. If stock prices display momentum, then we might expect the closing price to be equal to either the high or the low price for the day. Why? Compare the closing price each day to the day's high price, the day's low price, and the midpoint of the high and low prices. What does this tell you about the tendency of stock prices to move randomly? The Super Bowl indicator predicts that the stock market will decline in a year following a Super Bowl victory by a team from the old American Football League (AFL) and that the market will otherwise rise. The following table lists the signal that this indicator gave to investors in each year from 1967 to 2004 as well as the returns on the Dow Jones Industrial Average (DJIA) in the 12 months after each Super Bowl. (There is no prediction for 2003 because the Tampa Bay Buccaneers-an expansion team that had never been part of either the AFI or NFL-won that year.) 10-11. Super Bowl Subsequent Super Bowl Subsequent indicator indicator Sell NA DJIA (%) DJIA (96) Year 2004 2003 2002 2001 2000 1999 Year 1985 1984 1983 Sell Buy 33.1 11.2 16.8 34.9 15.4 12.9 6.7 9.0 -20.7 -3.7 Buy Sell Sell Sell 1998 Seli 1997 1996 1995 1994 1993 1992 1991 1990 1989 1988 1987 1979 1978 1977 1976 1975 1974 1973 1972 1971 1970 1969 1968 1967 24.3 25.4 36.8 4.7 13.7 uy uy uy uy uy Buy uy uy uy uy Buy uy Sell Sell Sell Sell Sell 38.0 14.1 9.9 13.4 Sell Sell Sell 16.3 13.0 14.1 7.7 0.1 30.1 a. Calculate the compound annual percentage return on the DJIA over this period. b. Suppose that you have followed the Super Bowl indicator every year since 1967. Specifically, when the indicator directed you to buy stocks, you held a portfolio that earned a return comparable to that of the DJIA. In years when the indicator suggested that you should sell stocks, you put your money in Treasury bills earning 4%. (Also assume that you invest in T-bills during 2003, when the indicator does not yield a signal.) Calculate the compound annual rate of return on this strategy. The New England Patriots (a former AFL team) won the Super Bowl in 2005. How did U.S. stocks fare in that year? cStep by Step Solution
There are 3 Steps involved in it
Step: 1

Get Instant Access to Expert-Tailored Solutions
See step-by-step solutions with expert insights and AI powered tools for academic success
Step: 2

Step: 3

Ace Your Homework with AI
Get the answers you need in no time with our AI-driven, step-by-step assistance
Get Started


