please help
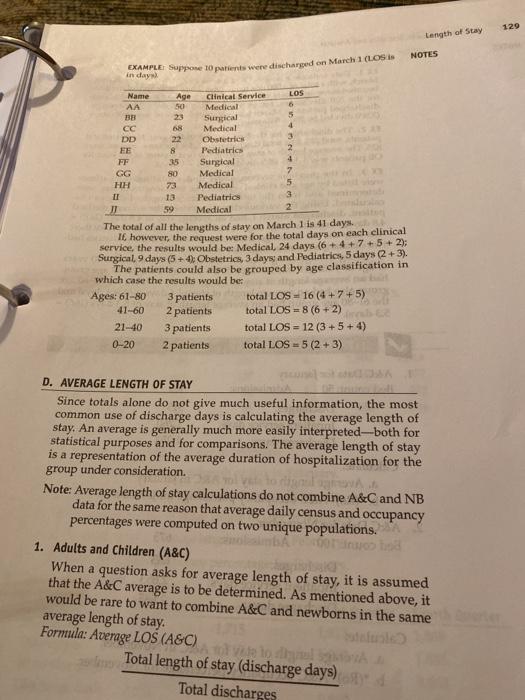
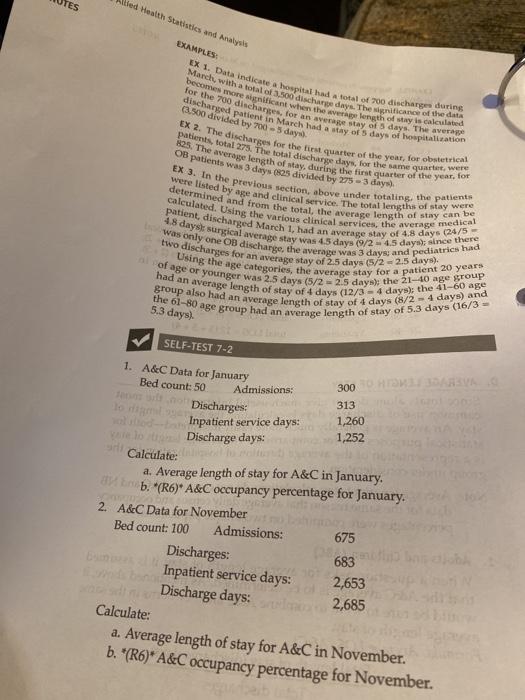
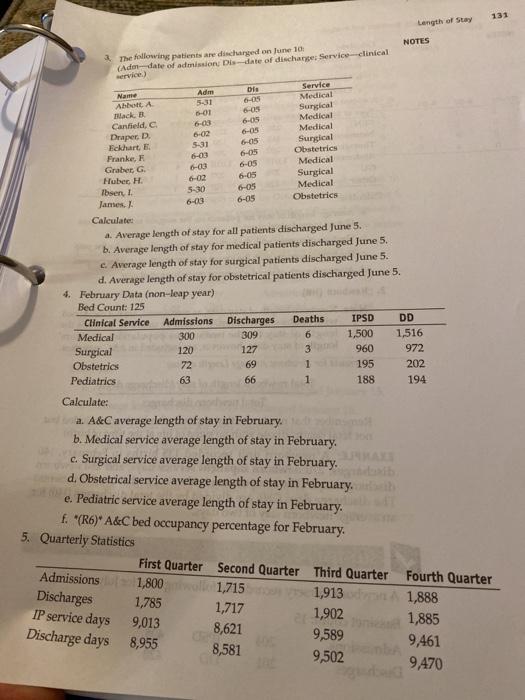
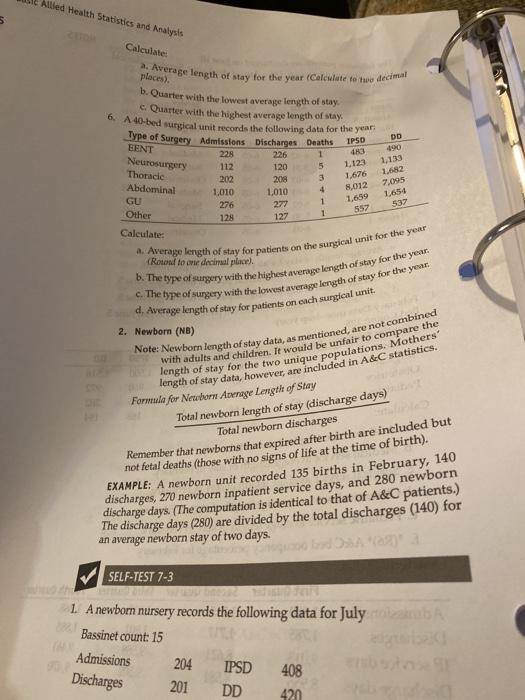
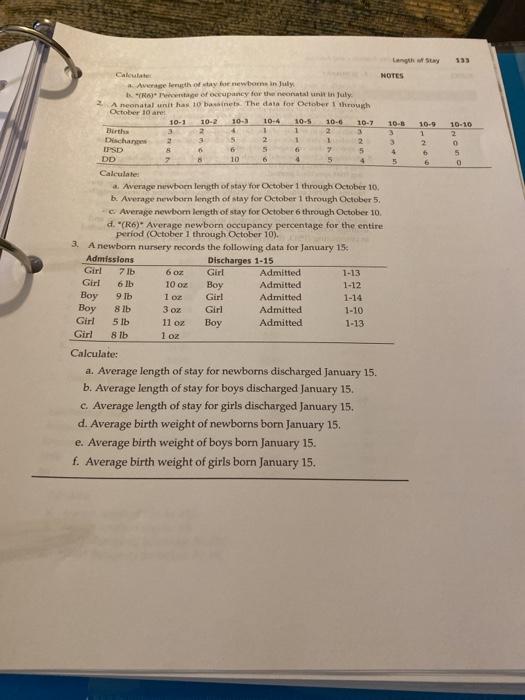
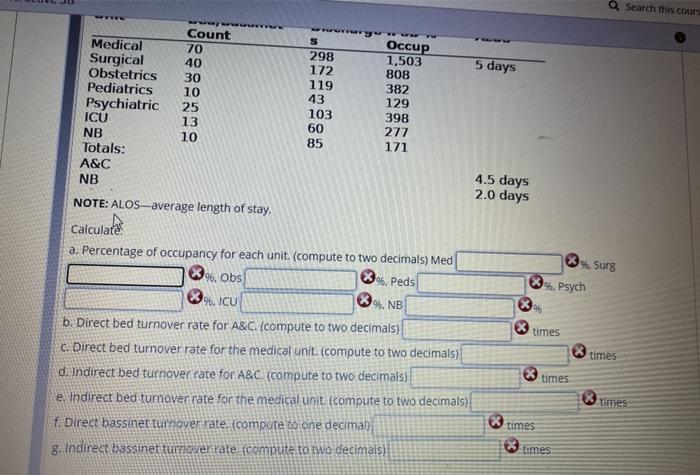
129 Length of stay NOTES EXAMPLE Suppone 10 patients were discharged on March (LOSIS LOS 6 5 Name Age Clinical Service AA 50 Medical BB 23 Surgical 4 CC 68 Medical 3 DD 22 Obstetrics EE 8 Pediatrics 2 4 FF 35 Surgical GG 80 Medical 7 HH 73 Medical 5 II 13 Pediatrics 59 Medical 2 The total of all the lengths of stay on March 1 is 41 days. It however, the request were for the total days on each clinical service, the results would be: Medical, 24 days (6 + 4 +7 +5+ 2); Surgical 9 days (5 + 4). Obstetrics, 3 days, and Pediatrics, 5 days (2+3). The patients could also be grouped by age classification in which case the results would be Ages: 61-80 3 patients total LOS - 16 (4 +7+5) 41-60 2 patients total LOS 8(6+2) 21-40 3 patients total LOS - 12 (3+5+4) 0-20 2 patients total LOS 5 (2+3) D. AVERAGE LENGTH OF STAY Since totals alone do not give much useful information, the most common use of discharge days is calculating the average length of stay. An average is generally much more easily interpreted-both for statistical purposes and for comparisons. The average length of stay is a representation of the average duration of hospitalization for the group under consideration. Note: Average length of stay calculations do not combine A&C and NB data for the same reason that average daily census and occupancy percentages were computed on two unique populations. 1. Adults and Children (A&C) When a question asks for average length of stay, it is assumed that the A&C average is to be determined. As mentioned above, would be rare to want to combine A&C and newborns in the same average length of stay. Formula: Average LOS (A&C) te logo Total length of stay (discharge days) Total discharges EX 1. Data indicate a hospital had a total of 200 discharge during March with a total of 3.500 discharge days. The significance of the data becomes significant when the length of stay is calculated for the 700 discharges for an avere stay of 3 days. The average EX 2. The discharge for the first quarter of the year, for obstetrical patients, total 273. The total discharge days for the same quartet, were 825. The average length of stay, during the first quarter of the year, for OB patients was 3 days 0825 divided by 275 - 3 days) EX 3. In the previous section, above under totaling the patients were listed by age and clinical service. The total length of stay were determined and from the total, the average length of stay can be calculated. Using the various clinical services, the average medical was only one OB discharge, the average was 3 days and pediatrics had 48 days surgical average stay was 4.5 days (9/ 24.5 days since there two discharges for an average stay of 2.5 days (5/22.5 days). of age or younger was 25 days (5/ 22.5 days): the 21-10 age group Using the age categories, the average stay for a patient 20 years had an average length of stay of 4 days (12/3 - 4 days), the 41-60 age the 61-80 age group had an average length of stay of 5.3 days (16/3 Broup also had an average length of stay of 4 days (8/2 - 4 days) and discharged patient in March had a stay of 5 days of hospitalization patient, discharged March 1, had an average stay of 4.8 days (24/5 lied Health Statistics and Analysis EXAMPLES 3.500 divided by 700 - 3 days 5.3 days) SELF-TEST 7-2 1. A&C Data for January Bed count: 50 Discharges: 300 DREVA Admissions: 313 1,260 Inpatient service days: 1,252 Discharge days: Calculate: a. Average length of stay for A&C in January. b. "(R6)* A&C occupancy percentage for January. 2. A&C Data for November Bed count: 100 Admissions: 675 Discharges: 682 683 Inpatient service days: 2,653 Discharge days: 2,685 Calculate: a. Average length of stay for A&C in November. b. *(R6)* A&C occupancy percentage for November. 131 6-05 Length of stay NOTES The following patients are discharged on June 10 (Ado-date of admission Dis-date of discharges Servico-clinical service) Adm Name DI Service 6-05 5.31 Abbott A Medical Black B 6-01 6-05 Surgical Canfield, 6-03 Medical 6-02 Draper D 6-05 Medical Eckhart E. 5-31 6-05 Surgical Franke, 6-05 Obstetrics Graber, G 6-03 6-05 Medical Huber, H. 6-02 6-05 Surgical Ibsen 1 5.30 6-05 Medical James 6-03 6-05 Obstetrics Calculated a. Average length of stay for all patients discharged June 5. b. Average length of stay for medical patients discharged June 5, c. Average length of stay for surgical patients discharged June 5. d. Average length of stay for obstetrical patients discharged June 5. 4. February Data (non-leap year) Bed Count: 125 Clinical Service Admissions Discharges Deaths IPSD DD Medical 300 309 6 1,500 1,516 Surgical 120 127 3 960 972 Obstetrics 72 69 1 195 202 Pediatrics 63 66 1 188 194 Calculate: a. A&C average length of stay in February b. Medical service average length of stay in February c. Surgical service average length of stay in February d. Obstetrical service average length of stay in February e. Pediatric service average length of stay in February. f. "(R6)* A&C bed occupancy percentage for February 5. Quarterly Statistics First Quarter Second Quarter Third Quarter Fourth Quarter Admissions 1,800 1,715 1,913 1,888 Discharges 1,785 1,717 1,902 1,885 9,013 8,621 9,589 9,461 Discharge days 8,955 8,581 9,502 9,470 IP service days length of stay data, however, are included in A&C statistics. Auled Health Statistics and Analysis Calculate: places). b. Quarter with the lowest average length of stay e Quarter with the highest average length of stay. IPSD 483 1,123 EENT Neurosurgery Thoracic a. Average length of stay for the year (Calculate the decimal 6. A 40-bed surgical unit records the following data for the year a. Average length of stay for patients on the surgical unit for the year b. The type of surgery with the highest average length of stay for the year c. The type of surgery with the lowest average length of stay for the year d. Average length of stay for patients on each surgical unit Note: Newborn length of stay data, as mentioned, are not combined with adults and children. It would be unfair to compare the length of stay for the two unique populations. Mothers' Type of Surgery Admissions Discharges Deaths 228 226 1 112 120 202 208 Abdominal 1,010 1,010 GU 276 277 128 (Roond to nie decimal place). 2. Newborn (NB) 5 OD 490 1,133 1.682 7,095 1654 4 1 1 1.676 8,012 1,659 557 537 127 Other Calculate Formula for Newborn Avenge Length of Stay Total newborn length of stay (discharge days) Total newborn discharges Remember that newborns that expired after birth are included but not fetal deaths (those with no signs of life at the time of birth). EXAMPLE: A newborn unit recorded 135 births in February, 140 discharges, 270 newborn inpatient service days, and 280 newborn discharge days (The computation is identical to that of A&C patients.) The discharge days (280) are divided by the total discharges (140) for an average newborn stay of two days. 22 SELF-TEST 7-3 1. A newborn nursery records the following data for July Bassinet count: 15 Admissions 204 IPSD 408 201 DD 420 Discharges 133 10-10 2 3 10-9 1 2 6 6 5 0 Calculate NOTES Avengerth of stay for newborn in July IR) of occupancy for the neonatalni in July 2 A neonatal unit has 10 barnets. The data for October 1 through October 10 are 10-1 10-2 10-3 10-4 10-5 10-6 10-7 10-5 3 2 1 1 3 Discha 3 3 5 2 1 1 2 8 6 6 6 7 5 4 DD 8 10 6 4 5 4 5 Calculate Average newborn length of stay for October 1 through October 10, b. Average newborn length of stay for October 1 through October 5, c Average newborn length of stay for October 6 through October 10. d. "(R6) Average newborn occupancy percentage for the entire period (October 1 through October 10). 3. A newborn nursery records the following data for January 15 Admissions Discharges 1-15 Girl 7 lb 6 OZ Girl Admitted 1-13 Girl 6 lb 10 OZ Boy Admitted 1-12 Boy 9 Tb 1 oz Girl Admitted 1-14 Boy 87b Girl Admitted 1-10 Girl 5 lb 11 oz Boy Admitted 1-13 Girl 8 lb 1 oz Calculate: a. Average length of stay for newborns discharged January 15. b. Average length of stay for boys discharged January 15, c. Average length of stay for girls discharged January 15. d. Average birth weight of newborns born January 15. e. Average birth weight of boys born January 15. f. Average birth weight of girls born January 15. 30 a Search this cours 5 days WWE Count S Medical Occup 70 298 Surgical 1,503 40 172 808 Obstetrics 30 119 382 Pediatrics 10 43 129 Psychiatric 25 103 398 ICU 13 60 277 NB 10 85 171 Totals: A&C NB NOTE: ALOS-average length of stay. Calculate a. Percentage of occupancy for each unit. (compute to two decimals) Med %. Obs 4.5 days 2.0 days 3. Peds %. Surg 9. Psych 3%. ICU 9. NB times times b. Direct bed turnover rate for A&C. (compute to two decimals) c. Direct bed turnover rate for the medical unit. (compute to two decimals) d. Indirect bed turnover rate for A&c (compute to two decimals) e. Indirect bed turnover rate for the medical unit. (compute to two decimals) f. Direct bassinet turnover rate. (compute to one decimal) g. Indirect bassinet turnoverrate compute to two decimals) times times times times 129 Length of stay NOTES EXAMPLE Suppone 10 patients were discharged on March (LOSIS LOS 6 5 Name Age Clinical Service AA 50 Medical BB 23 Surgical 4 CC 68 Medical 3 DD 22 Obstetrics EE 8 Pediatrics 2 4 FF 35 Surgical GG 80 Medical 7 HH 73 Medical 5 II 13 Pediatrics 59 Medical 2 The total of all the lengths of stay on March 1 is 41 days. It however, the request were for the total days on each clinical service, the results would be: Medical, 24 days (6 + 4 +7 +5+ 2); Surgical 9 days (5 + 4). Obstetrics, 3 days, and Pediatrics, 5 days (2+3). The patients could also be grouped by age classification in which case the results would be Ages: 61-80 3 patients total LOS - 16 (4 +7+5) 41-60 2 patients total LOS 8(6+2) 21-40 3 patients total LOS - 12 (3+5+4) 0-20 2 patients total LOS 5 (2+3) D. AVERAGE LENGTH OF STAY Since totals alone do not give much useful information, the most common use of discharge days is calculating the average length of stay. An average is generally much more easily interpreted-both for statistical purposes and for comparisons. The average length of stay is a representation of the average duration of hospitalization for the group under consideration. Note: Average length of stay calculations do not combine A&C and NB data for the same reason that average daily census and occupancy percentages were computed on two unique populations. 1. Adults and Children (A&C) When a question asks for average length of stay, it is assumed that the A&C average is to be determined. As mentioned above, would be rare to want to combine A&C and newborns in the same average length of stay. Formula: Average LOS (A&C) te logo Total length of stay (discharge days) Total discharges EX 1. Data indicate a hospital had a total of 200 discharge during March with a total of 3.500 discharge days. The significance of the data becomes significant when the length of stay is calculated for the 700 discharges for an avere stay of 3 days. The average EX 2. The discharge for the first quarter of the year, for obstetrical patients, total 273. The total discharge days for the same quartet, were 825. The average length of stay, during the first quarter of the year, for OB patients was 3 days 0825 divided by 275 - 3 days) EX 3. In the previous section, above under totaling the patients were listed by age and clinical service. The total length of stay were determined and from the total, the average length of stay can be calculated. Using the various clinical services, the average medical was only one OB discharge, the average was 3 days and pediatrics had 48 days surgical average stay was 4.5 days (9/ 24.5 days since there two discharges for an average stay of 2.5 days (5/22.5 days). of age or younger was 25 days (5/ 22.5 days): the 21-10 age group Using the age categories, the average stay for a patient 20 years had an average length of stay of 4 days (12/3 - 4 days), the 41-60 age the 61-80 age group had an average length of stay of 5.3 days (16/3 Broup also had an average length of stay of 4 days (8/2 - 4 days) and discharged patient in March had a stay of 5 days of hospitalization patient, discharged March 1, had an average stay of 4.8 days (24/5 lied Health Statistics and Analysis EXAMPLES 3.500 divided by 700 - 3 days 5.3 days) SELF-TEST 7-2 1. A&C Data for January Bed count: 50 Discharges: 300 DREVA Admissions: 313 1,260 Inpatient service days: 1,252 Discharge days: Calculate: a. Average length of stay for A&C in January. b. "(R6)* A&C occupancy percentage for January. 2. A&C Data for November Bed count: 100 Admissions: 675 Discharges: 682 683 Inpatient service days: 2,653 Discharge days: 2,685 Calculate: a. Average length of stay for A&C in November. b. *(R6)* A&C occupancy percentage for November. 131 6-05 Length of stay NOTES The following patients are discharged on June 10 (Ado-date of admission Dis-date of discharges Servico-clinical service) Adm Name DI Service 6-05 5.31 Abbott A Medical Black B 6-01 6-05 Surgical Canfield, 6-03 Medical 6-02 Draper D 6-05 Medical Eckhart E. 5-31 6-05 Surgical Franke, 6-05 Obstetrics Graber, G 6-03 6-05 Medical Huber, H. 6-02 6-05 Surgical Ibsen 1 5.30 6-05 Medical James 6-03 6-05 Obstetrics Calculated a. Average length of stay for all patients discharged June 5. b. Average length of stay for medical patients discharged June 5, c. Average length of stay for surgical patients discharged June 5. d. Average length of stay for obstetrical patients discharged June 5. 4. February Data (non-leap year) Bed Count: 125 Clinical Service Admissions Discharges Deaths IPSD DD Medical 300 309 6 1,500 1,516 Surgical 120 127 3 960 972 Obstetrics 72 69 1 195 202 Pediatrics 63 66 1 188 194 Calculate: a. A&C average length of stay in February b. Medical service average length of stay in February c. Surgical service average length of stay in February d. Obstetrical service average length of stay in February e. Pediatric service average length of stay in February. f. "(R6)* A&C bed occupancy percentage for February 5. Quarterly Statistics First Quarter Second Quarter Third Quarter Fourth Quarter Admissions 1,800 1,715 1,913 1,888 Discharges 1,785 1,717 1,902 1,885 9,013 8,621 9,589 9,461 Discharge days 8,955 8,581 9,502 9,470 IP service days length of stay data, however, are included in A&C statistics. Auled Health Statistics and Analysis Calculate: places). b. Quarter with the lowest average length of stay e Quarter with the highest average length of stay. IPSD 483 1,123 EENT Neurosurgery Thoracic a. Average length of stay for the year (Calculate the decimal 6. A 40-bed surgical unit records the following data for the year a. Average length of stay for patients on the surgical unit for the year b. The type of surgery with the highest average length of stay for the year c. The type of surgery with the lowest average length of stay for the year d. Average length of stay for patients on each surgical unit Note: Newborn length of stay data, as mentioned, are not combined with adults and children. It would be unfair to compare the length of stay for the two unique populations. Mothers' Type of Surgery Admissions Discharges Deaths 228 226 1 112 120 202 208 Abdominal 1,010 1,010 GU 276 277 128 (Roond to nie decimal place). 2. Newborn (NB) 5 OD 490 1,133 1.682 7,095 1654 4 1 1 1.676 8,012 1,659 557 537 127 Other Calculate Formula for Newborn Avenge Length of Stay Total newborn length of stay (discharge days) Total newborn discharges Remember that newborns that expired after birth are included but not fetal deaths (those with no signs of life at the time of birth). EXAMPLE: A newborn unit recorded 135 births in February, 140 discharges, 270 newborn inpatient service days, and 280 newborn discharge days (The computation is identical to that of A&C patients.) The discharge days (280) are divided by the total discharges (140) for an average newborn stay of two days. 22 SELF-TEST 7-3 1. A newborn nursery records the following data for July Bassinet count: 15 Admissions 204 IPSD 408 201 DD 420 Discharges 133 10-10 2 3 10-9 1 2 6 6 5 0 Calculate NOTES Avengerth of stay for newborn in July IR) of occupancy for the neonatalni in July 2 A neonatal unit has 10 barnets. The data for October 1 through October 10 are 10-1 10-2 10-3 10-4 10-5 10-6 10-7 10-5 3 2 1 1 3 Discha 3 3 5 2 1 1 2 8 6 6 6 7 5 4 DD 8 10 6 4 5 4 5 Calculate Average newborn length of stay for October 1 through October 10, b. Average newborn length of stay for October 1 through October 5, c Average newborn length of stay for October 6 through October 10. d. "(R6) Average newborn occupancy percentage for the entire period (October 1 through October 10). 3. A newborn nursery records the following data for January 15 Admissions Discharges 1-15 Girl 7 lb 6 OZ Girl Admitted 1-13 Girl 6 lb 10 OZ Boy Admitted 1-12 Boy 9 Tb 1 oz Girl Admitted 1-14 Boy 87b Girl Admitted 1-10 Girl 5 lb 11 oz Boy Admitted 1-13 Girl 8 lb 1 oz Calculate: a. Average length of stay for newborns discharged January 15. b. Average length of stay for boys discharged January 15, c. Average length of stay for girls discharged January 15. d. Average birth weight of newborns born January 15. e. Average birth weight of boys born January 15. f. Average birth weight of girls born January 15. 30 a Search this cours 5 days WWE Count S Medical Occup 70 298 Surgical 1,503 40 172 808 Obstetrics 30 119 382 Pediatrics 10 43 129 Psychiatric 25 103 398 ICU 13 60 277 NB 10 85 171 Totals: A&C NB NOTE: ALOS-average length of stay. Calculate a. Percentage of occupancy for each unit. (compute to two decimals) Med %. Obs 4.5 days 2.0 days 3. Peds %. Surg 9. Psych 3%. ICU 9. NB times times b. Direct bed turnover rate for A&C. (compute to two decimals) c. Direct bed turnover rate for the medical unit. (compute to two decimals) d. Indirect bed turnover rate for A&c (compute to two decimals) e. Indirect bed turnover rate for the medical unit. (compute to two decimals) f. Direct bassinet turnover rate. (compute to one decimal) g. Indirect bassinet turnoverrate compute to two decimals) times times times times


