Answered step by step
Verified Expert Solution
Question
1 Approved Answer
Please help and illustrate how to calculate. Question 2 Not complete Marked out of 1.00 Flag question Analysis and Interpretation of Profitability Balance sheets and


Please help and illustrate how to calculate.
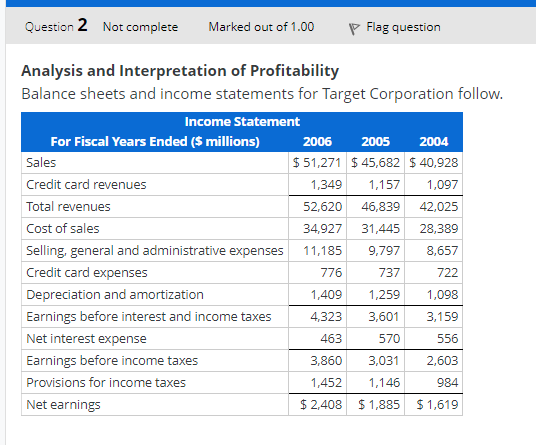
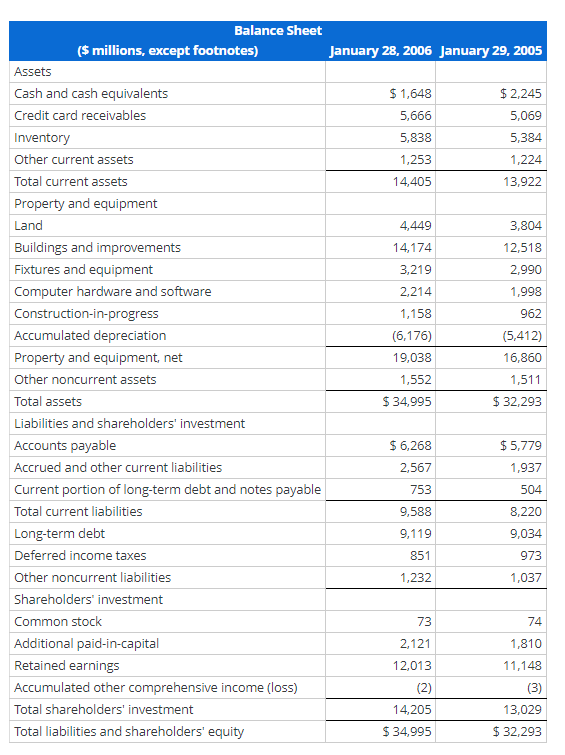
Question 2 Not complete Marked out of 1.00 Flag question Analysis and Interpretation of Profitability Balance sheets and income statements for Target Corporation follow. Income Statement For Fiscal Years Ended ($ millions) 2006 2005 2004 Sales $ 51,271 $45,682 $ 40,928 Credit card revenues 1,349 1,157 1,097 Total revenues 52,620 46,839 42,025 Cost of sales 34,927 31,445 28,389 Selling, general and administrative expenses 11,185 9,797 8,657 Credit card expenses 776 737 722 Depreciation and amortization 1,409 1,259 1,098 4,323 3,601 3,159 Earnings before interest and income taxes Net interest expense 463 570 556 Earnings before income taxes 3,860 3,031 2,603 Provisions for income taxes 1,452 1,146 984 Net earnings $2,408 $1,885 $ 1,619 Balance Sheet ($ millions, except footnotes) Assets Cash and cash equivalents Credit card receivables Inventory Other current assets Total current assets Property and equipment Land Buildings and improvements Fixtures and equipment Computer hardware and software Construction-in-progress Accumulated depreciation Property and equipment, net Other noncurrent assets Total assets Liabilities and shareholders' investment Accounts payable Accrued and other current liabilities Current portion of long-term debt and notes payable Total current liabilities Long-term debt Deferred income taxes Other noncurrent liabilities Shareholders' investment Common stock Additional paid-in-capital Retained earnings Accumulated other comprehensive income (loss) Total shareholders' investment Total liabilities and shareholders' equity January 28, 2006 January 29, 2005 $1,648 $2,245 5,666 5,069 5,838 5,384 1,253 1,224 14,405 13,922 4,449 3,804 14,174 12,518 3,219 2,990 2,214 1,998 1,158 962 (6,176) (5,412) 19,038 16,860 1,552 1,511 $34,995 $ 32,293 $ 6,268 $5,779 2,567 1,937 753 504 9,588 8,220 9,119 9,034 851 973 1,232 1,037 73 74 2,121 1,810 12,013 11,148 (2) (3) 14,205 13,029 $34,995 $ 32,293 (c) Compute Target's RNOA, net operating profit margin (NOPM) and net operating asset turnover (NOAT) for 2006. (Do not round until final answer. Round two decimal places. Do not use NOPM x NOAT to calculate RNOA.) 2006 RNOA = 12.01 * % 2006 NOPM = 5.25 * % 2006 NOAT = 2.29 x (d) Compute net nonoperating obligations (NNO) for 2006 and 2005. 2006 NNO = $ 16.95 x million 2005 NNO = $ 2 x million (e) Compute return on equity (ROE) for 2006. (Do not round until final answer. Round answer two decimal places.) 2006 ROE = 2 * % (f) Infer the nonoperating return component of ROE for 2006. (Use answers from above to calculate. Round your answer to two decimal places.) 2006 nonoperating return = 2 * %Step by Step Solution
There are 3 Steps involved in it
Step: 1

Get Instant Access to Expert-Tailored Solutions
See step-by-step solutions with expert insights and AI powered tools for academic success
Step: 2

Step: 3

Ace Your Homework with AI
Get the answers you need in no time with our AI-driven, step-by-step assistance
Get Started


