

Question
Please help. Bookbinders Book Club case study Introduction About 50,000 new titles, including new editions, are published in the United States each year, giving rise
Please help.
Bookbinders Book Club case study
Introduction About 50,000 new titles, including new editions, are published in the United States each year, giving rise to a $20+ billion book publishing industry. About 10 percent of the books are sold through mail order. Book retailing in the 1970s was characterized by the growth of chain bookstore operations in concert with the development of shopping malls. Traffic in bookstores in the 1980s was enhanced by the spread of discounting. In the 1990s, the superstore concept of book retailing was responsible for the double-digit growth of the book industry. Generally situated near large shopping centers, superstores maintain large inventories of anywhere from 30,000 to 80,000 titles. Superstores are putting intense competitive pressure on book clubs, mail-order firms and retail outlets. Recently, online superstores, such as www.amazon.com, have emerged, carrying 1-2.5 million titles and further intensifying the pressure on book clubs and mail-order firms. In response to these pressures, book clubs are starting to look at alternative business models that will make them more responsive to their customers' preferences. Historically, book clubs offered their readers continuity and negative option programs that were based on an extended contractual relationship between the club and its subscribers. In a continuity program, popular in such genres as children's books, a reader signs up for an offer of several books for a few dollars each (plus shipping and handling on each book) and agrees to receive a shipment of one or two books each month thereafter. In a negative option program, subscribers get to choose which and how many additional books they will receive, but the default option is that the club's selection will be delivered to them each month. The club informs them of the monthly selection and they must mark "no" on their order forms if they do not want to receive it. Some firms are now beginning to offer books on a positive-option basis, but only to selected segments of their customer lists that they deem receptive to specific offers. Book clubs are also beginning to use database marketing techniques to work smarter rather than expand the coverage of their mailings. According to Doubleday president Marcus Willhelm, "The database is the key to what we are doing.... We have to understand what our customers want and be more flexible. I doubt book clubs can survive if they offer the same 16 offers, the same fulfillment to everybody."2 Doubleday uses modeling techniques to look at more than 80 variables, including geography and the types of books customers purchase, and selects three to five variables that are the most influential predictors. The Bookbinders Book Club The BBB Club was established in 1986 for the purpose of selling specialty books through direct marketing. BBBC is strictly a distributor and does not publish any of the books it sells. In anticipation of using database marketing, BBBC made a strategic decision right from the start to build and maintain a detailed database about its members containing all the relevant information about them. Readers fill out an insert and return it to BBBC which then enters the data into the database. The company currently has a database of 500,000 readers and sends out a mailing about once a month. BBBC is exploring whether to use predictive modeling approaches to improve the efficacy of its direct mail program. For a recent mailing, the company selected 20,000 customers in Pennsylvania, New York and Ohio from its database and included with their regular mailing a specially produced brochure for the book The Art History of Florence. This resulted in a 9.03 percent response rate (1806 orders) for the purchase of the book. BBBC then developed a database to calibrate a response model to identify the factors that influencedthese purchases.
For this case analysis, we will use a subset of the database available to BBBC. It consists of data for 400 customers who purchased the book, and 1,200 customers who did not, thereby over-representing the response group. The dependent variable for the analysis is Choice -- purchase or no purchase of The Art History of Florence. BBBC also selected several independent variables that it thought might explain the observed choice behavior. Below is a description of the variables used for the analysis: Choice: Whether the customer purchased the The Art History of Florence. 1 corresponds to a purchase and 0 corresponds to a non purchase. Gender: 0 = Female and 1 = Male. Amount purchased: Total money spent on BBBC books. Frequency: Total number of purchases in the chosen period (used as a proxy for frequency.) Last purchase (recency of purchase): Months since last purchase. First purchase: Months since first purchase. P_Child: Number of children's books purchased. P_Youth: Number of youth books purchased. P_Cook: Number of cookbooks purchased. P_DIY: Number of do-it-yourself books purchased. P_Art: Number of art books purchased. To assess the performance of the model, the data set includes a second sheet with 2300customers--a holdout sample representative of the entire target market. The use of such a validation sample is an appropriate way to compare alternative models.
Case study questions
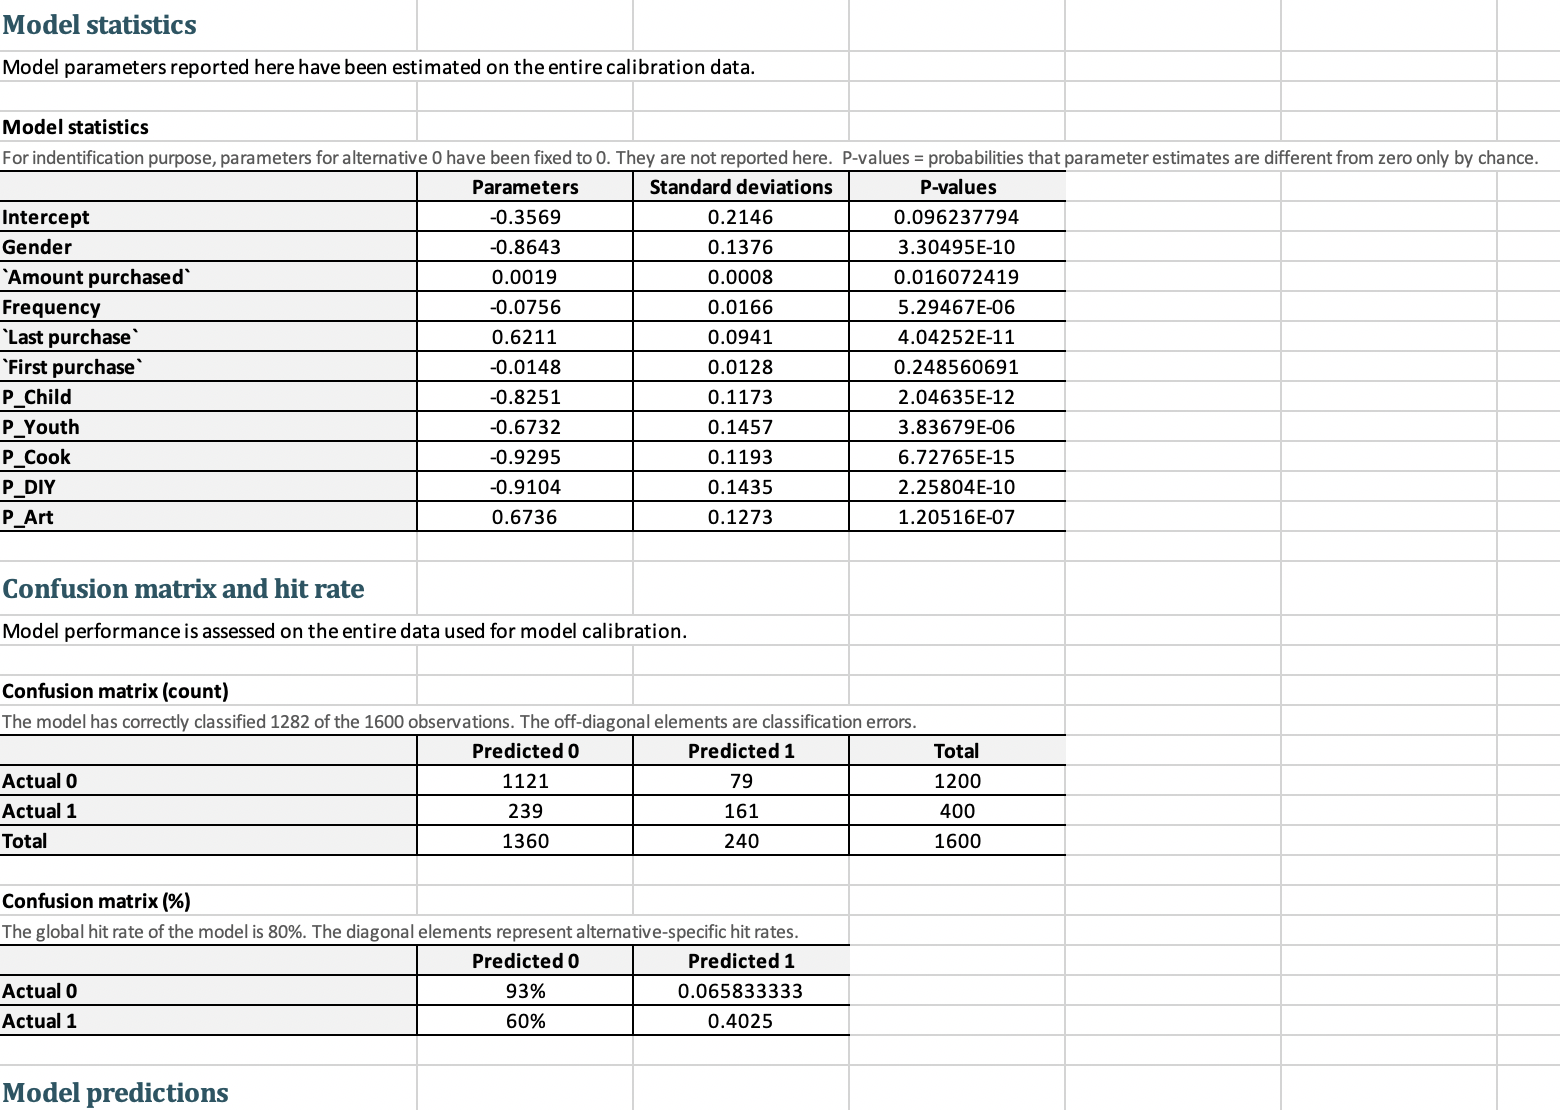
Question #1 Which attributes are significant predictors of the customer purchasing from BBC (where do the model statistics show a positive stat)? Specifically, which books do we sell best?
Question #2 Compare Amount purchased, Frequency, First and Last Purchase; what do you learn from those statistics?
Question #3 Those "Probability 1" column show those predicted to buy from BBC. Using the excel with the cleaned up and sorted excel data, 400 accounts actually bought from BBC, but how many more accounts should we target and why?
Question #4 What insights do you gain from the 400 that purchased from BBC using this predictivemodel?
Step by Step Solution
There are 3 Steps involved in it
Step: 1

Get Instant Access to Expert-Tailored Solutions
See step-by-step solutions with expert insights and AI powered tools for academic success
Step: 2

Step: 3
Ace Your Homework with AI
Get the answers you need in no time with our AI-driven, step-by-step assistance
Get Started
Marketing Management
Authors: Greg Marshall, Mark Johnston
2nd edition
9781259094972, 78028868, 1259094979, 978-0078028861