

Question
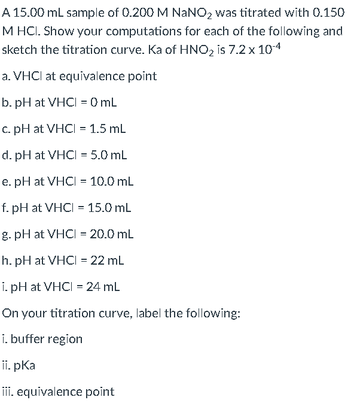
Please help. Complete answer for asked including the diagram of the titration curve on a graph with labels too. Please show computation for all. not
Please help. Complete answer for asked including the diagram of the titration curve on a graph with labels too. Please show computation for all. not ASAP, please take your time.
Step by Step Solution
There are 3 Steps involved in it
Step: 1

Get Instant Access to Expert-Tailored Solutions
See step-by-step solutions with expert insights and AI powered tools for academic success
Step: 2

Step: 3
Ace Your Homework with AI
Get the answers you need in no time with our AI-driven, step-by-step assistance
Get Started
Organic Chemistry
Authors: T. W. Graham Solomons, Craig B. Fryhle, Scott A. Snyder
12th Edition
1118875761, 978-1118875766