Answered step by step
Verified Expert Solution
Question
1 Approved Answer
PLEASE HELP!!!! DUE AT MIDNIGHT Historical Balance Sheets and Income Statements o P ull the latest balance sheet and income statement from the 10-K annual
PLEASE HELP!!!! DUE AT MIDNIGHT 


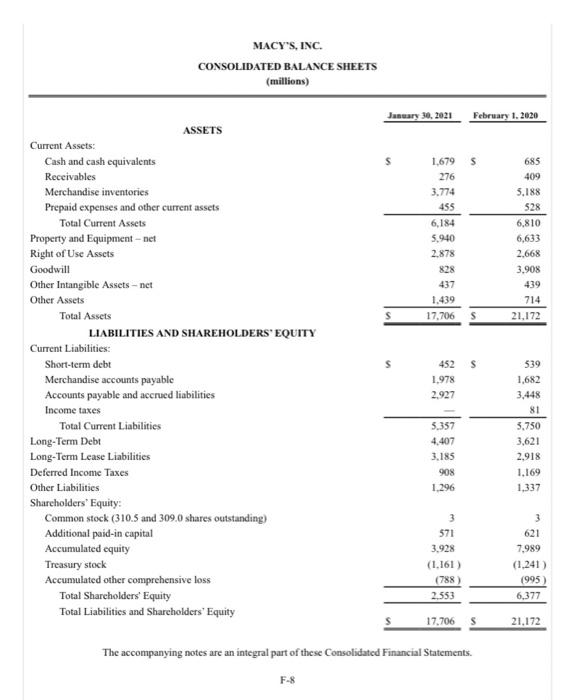
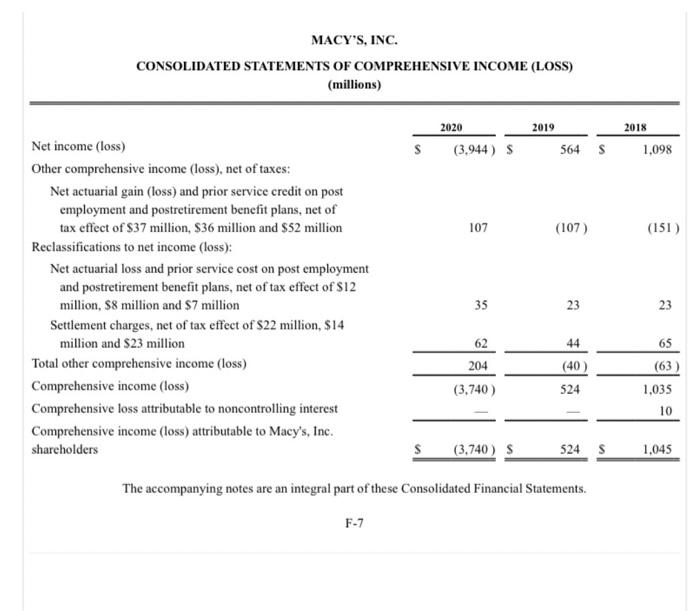
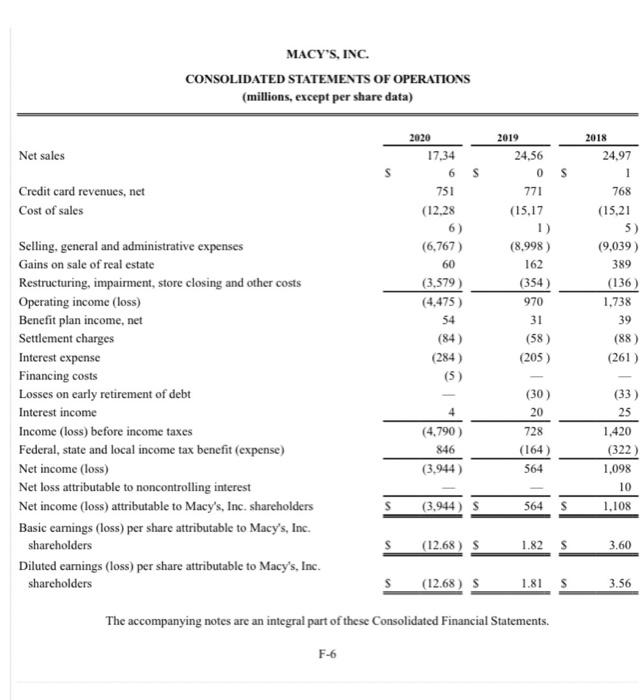
MACY'S, INC. CONSOLIDATED BALANCE SHEETS (millions) January 30, 2021 February 1.2020 s 1.679 276 3.774 455 6,184 5.940 2.878 828 437 1.439 17,706 685 409 5,188 528 6,810 6,633 2.668 3.908 439 714 21.172 ASSETS Current Assets Cash and cash equivalents Receivables Merchandise inventories Prepaid expenses and other current assets Total Current Assets Property and Equipment - net Right of Use Assets Goodwill Other Intangible Assets - net Other Assets Total Assets LIABILITIES AND SHAREHOLDERS' EQUITY Current Liabilities: Short-term debt Merchandise accounts payable Accounts payable and accrued liabilities Income taxes Total Current Liabilities Long-Term Debt Long-Term Lease Liabilities Deferred Income Taxes Other Liabilities Shareholders' Equity: Common stock (310.5 and 309.0 shares outstanding) Additional paid-in capital Accumulated equity Treasury stock Accumulated other comprehensive loss Total Shareholders' Equity Total Liabilities and Shareholders' Equity 452 S 1.978 2.927 5.357 4,407 3.185 908 1.296 539 1,682 3.448 81 3.750 3,621 2,918 1.169 1,337 3 571 3.928 (1.161) (788) 2.553 3 621 7,989 (1,241) (995) 6,377 17.706 S 21.172 The accompanying notes are an integral part of these Consolidated Financial Statements. F-8 MACY'S, INC. CONSOLIDATED STATEMENTS OF COMPREHENSIVE INCOME (LOSS) (millions) 2019 2018 2020 (3.944) S 564 S 1,098 107 (107) (151) Net income (loss) Other comprehensive income (loss), net of taxes: Net actuarial gain (loss) and prior service credit on post employment and postretirement benefit plans, net of tax effect of $37 million, S36 million and $52 million Reclassifications to net income (loss): Net actuarial loss and prior service cost on post employment and postretirement benefit plans, net of tax effect of S12 million, 88 million and $7 million Settlement charges, net of tax effect of S22 million, $14 million and S23 million Total other comprehensive income (loss) Comprehensive income (loss) Comprehensive loss attributable to noncontrolling interest Comprehensive income (loss) attributable to Macy's, Inc. shareholders 35 23 23 44 65 62 204 (40) 524 (63) 1,035 (3.740 ) 10 s (3,740) $ 524 S 1.045 The accompanying notes are an integral part of these Consolidated Financial Statements. F-7 MACY'S, INC. CONSOLIDATED STATEMENTS OF OPERATIONS (millions, except per share data) 2018 Net sales S S Credit card revenues, net Cost of sales 2020 17.34 6 751 (12.28 6) (6,767) 60 (3.579) (4,475) 54 (84) (284) (5) 2019 24.56 0 771 (15.17 1) (8.998) 162 (354) 24.97 1 768 (15,21 5) (9,039) 389 (136) 1.738 39 (88) (261) 970 31 (58) (205) (33) Selling, general and administrative expenses Gains on sale of real estate Restructuring, impairment, store closing and other costs Operating income (loss) Benefit plan income, net Settlement charges Interest expense Financing costs Losses on early retirement of debt Interest income Income (loss) before income taxes Federal, state and local income tax benefit (expense) Net income (loss) Net loss attributable to noncontrolling interest Net income (loss) attributable to Macy's, Inc. shareholders Basic earnings (loss) per share attributable to Macy's, Inc. shareholders Diluted earnings (loss) per share attributable to Macy's, Inc. shareholders 4 (4.790) 846 (3.944) (30) 20 728 (164) 564 25 1,420 (322) 1,098 10 1.108 s (3.944) S 564 $ s (12.68 ) S 1.82 S 3.60 s (12.68 ) S 1.81 $ 3.56 The accompanying notes are an integral part of these Consolidated Financial Statements. F-6 MACY'S, INC. CONSOLIDATED BALANCE SHEETS (millions) January 30, 2021 February 1.2020 s 1.679 276 3.774 455 6,184 5.940 2.878 828 437 1.439 17,706 685 409 5,188 528 6,810 6,633 2.668 3.908 439 714 21.172 ASSETS Current Assets Cash and cash equivalents Receivables Merchandise inventories Prepaid expenses and other current assets Total Current Assets Property and Equipment - net Right of Use Assets Goodwill Other Intangible Assets - net Other Assets Total Assets LIABILITIES AND SHAREHOLDERS' EQUITY Current Liabilities: Short-term debt Merchandise accounts payable Accounts payable and accrued liabilities Income taxes Total Current Liabilities Long-Term Debt Long-Term Lease Liabilities Deferred Income Taxes Other Liabilities Shareholders' Equity: Common stock (310.5 and 309.0 shares outstanding) Additional paid-in capital Accumulated equity Treasury stock Accumulated other comprehensive loss Total Shareholders' Equity Total Liabilities and Shareholders' Equity 452 S 1.978 2.927 5.357 4,407 3.185 908 1.296 539 1,682 3.448 81 3.750 3,621 2,918 1.169 1,337 3 571 3.928 (1.161) (788) 2.553 3 621 7,989 (1,241) (995) 6,377 17.706 S 21.172 The accompanying notes are an integral part of these Consolidated Financial Statements. F-8 MACY'S, INC. CONSOLIDATED STATEMENTS OF COMPREHENSIVE INCOME (LOSS) (millions) 2019 2018 2020 (3.944) S 564 S 1,098 107 (107) (151) Net income (loss) Other comprehensive income (loss), net of taxes: Net actuarial gain (loss) and prior service credit on post employment and postretirement benefit plans, net of tax effect of $37 million, S36 million and $52 million Reclassifications to net income (loss): Net actuarial loss and prior service cost on post employment and postretirement benefit plans, net of tax effect of S12 million, 88 million and $7 million Settlement charges, net of tax effect of S22 million, $14 million and S23 million Total other comprehensive income (loss) Comprehensive income (loss) Comprehensive loss attributable to noncontrolling interest Comprehensive income (loss) attributable to Macy's, Inc. shareholders 35 23 23 44 65 62 204 (40) 524 (63) 1,035 (3.740 ) 10 s (3,740) $ 524 S 1.045 The accompanying notes are an integral part of these Consolidated Financial Statements. F-7 MACY'S, INC. CONSOLIDATED STATEMENTS OF OPERATIONS (millions, except per share data) 2018 Net sales S S Credit card revenues, net Cost of sales 2020 17.34 6 751 (12.28 6) (6,767) 60 (3.579) (4,475) 54 (84) (284) (5) 2019 24.56 0 771 (15.17 1) (8.998) 162 (354) 24.97 1 768 (15,21 5) (9,039) 389 (136) 1.738 39 (88) (261) 970 31 (58) (205) (33) Selling, general and administrative expenses Gains on sale of real estate Restructuring, impairment, store closing and other costs Operating income (loss) Benefit plan income, net Settlement charges Interest expense Financing costs Losses on early retirement of debt Interest income Income (loss) before income taxes Federal, state and local income tax benefit (expense) Net income (loss) Net loss attributable to noncontrolling interest Net income (loss) attributable to Macy's, Inc. shareholders Basic earnings (loss) per share attributable to Macy's, Inc. shareholders Diluted earnings (loss) per share attributable to Macy's, Inc. shareholders 4 (4.790) 846 (3.944) (30) 20 728 (164) 564 25 1,420 (322) 1,098 10 1.108 s (3.944) S 564 $ s (12.68 ) S 1.82 S 3.60 s (12.68 ) S 1.81 $ 3.56 The accompanying notes are an integral part of these Consolidated Financial Statements. F-6 Historical Balance Sheets and Income Statements
o Pull the latest balance sheet and income statement from the 10-K annual report from SEC Edgar.
Horizontal and Vertical Analysis
o Perform horizontal and vertical analysis on the balance sheet and income statement for the current year.
Ratio Analysis
o Perform ratio analysis on your company, selecting at least 2 ratios from each basic category: liquidity, solvency, efficiency, and profitability. Compare with your companys prior year ratios and industry average ratios (https://www.readyratios.com/sec/industry/).
Part 3
Understand and Explain Analysis Results
o From the horizontal analysis, select at least 2 large or interesting changes (based on amount or percentage). I suggest line items such as revenue or cost of sales.
o Using the Management Discussion and Analysis (MD&A) section of the annual report (as well as other sources such as news articles), explain why those line items changed over time. You may need to dig deeper into the numbers (for instance breaking down revenue into company segments or regions), show any work you do.
Projected Financial Statements
o Project the balance sheet and income statements for 1 year into the future. Explain your assumptions for your projection. I suggest using outside reputable sources such as news articles and stock analysts reports to build your assumptions.b


Step by Step Solution
There are 3 Steps involved in it
Step: 1

Get Instant Access to Expert-Tailored Solutions
See step-by-step solutions with expert insights and AI powered tools for academic success
Step: 2

Step: 3

Ace Your Homework with AI
Get the answers you need in no time with our AI-driven, step-by-step assistance
Get Started


