Answered step by step
Verified Expert Solution
Question
1 Approved Answer
PLEASE HELP!!!!!! Gillian Pool and Spa Financial Statement Analysis The purpose of this project is to make students utilize the concepts and the tools we


PLEASE HELP!!!!!!
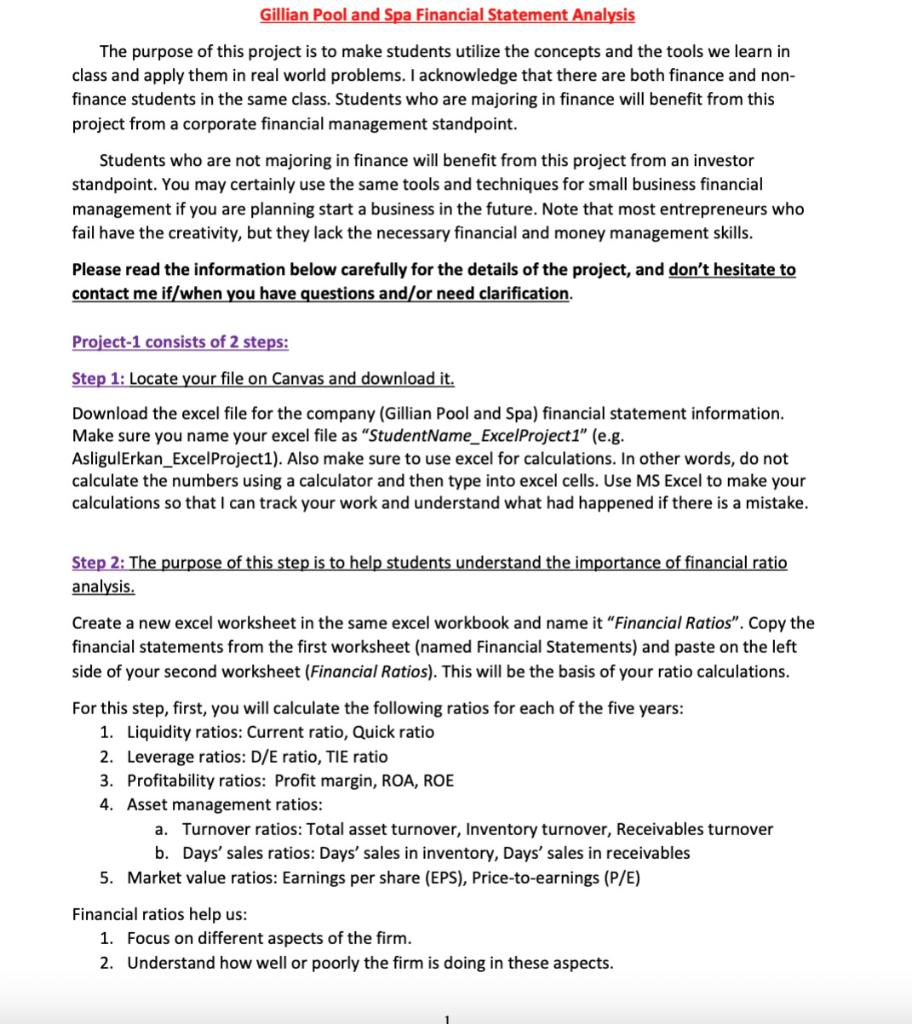
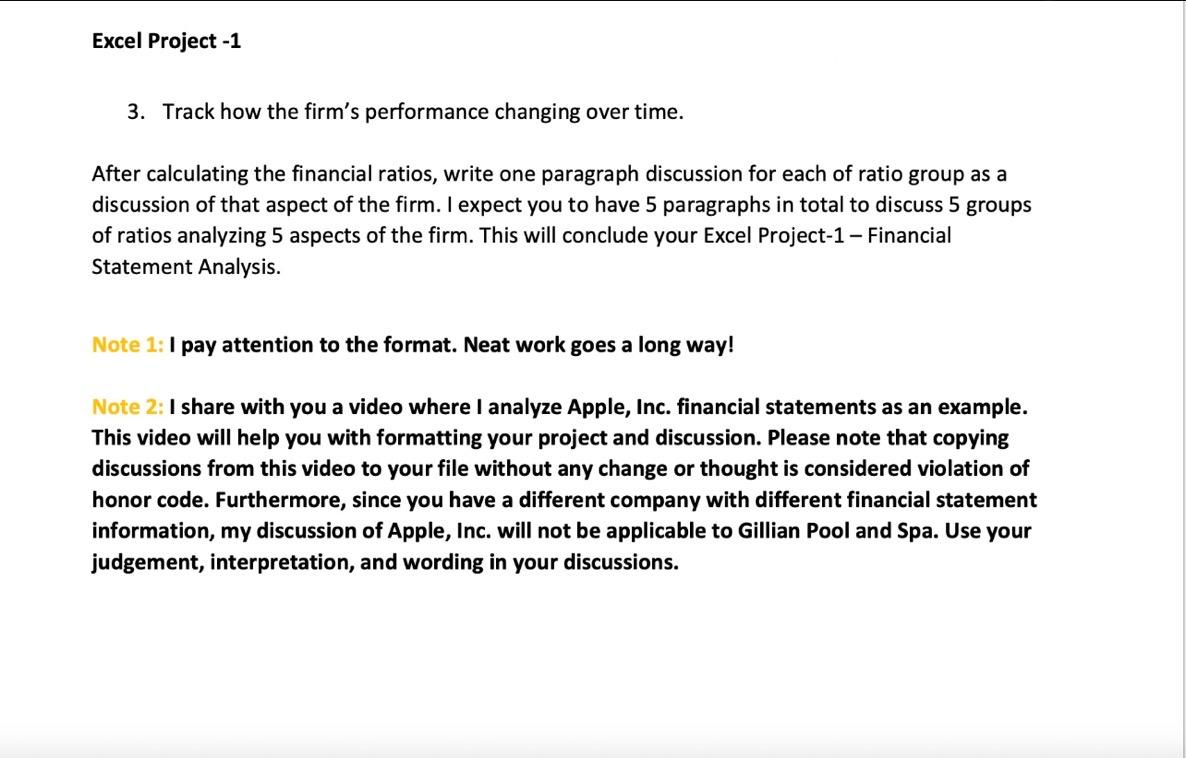
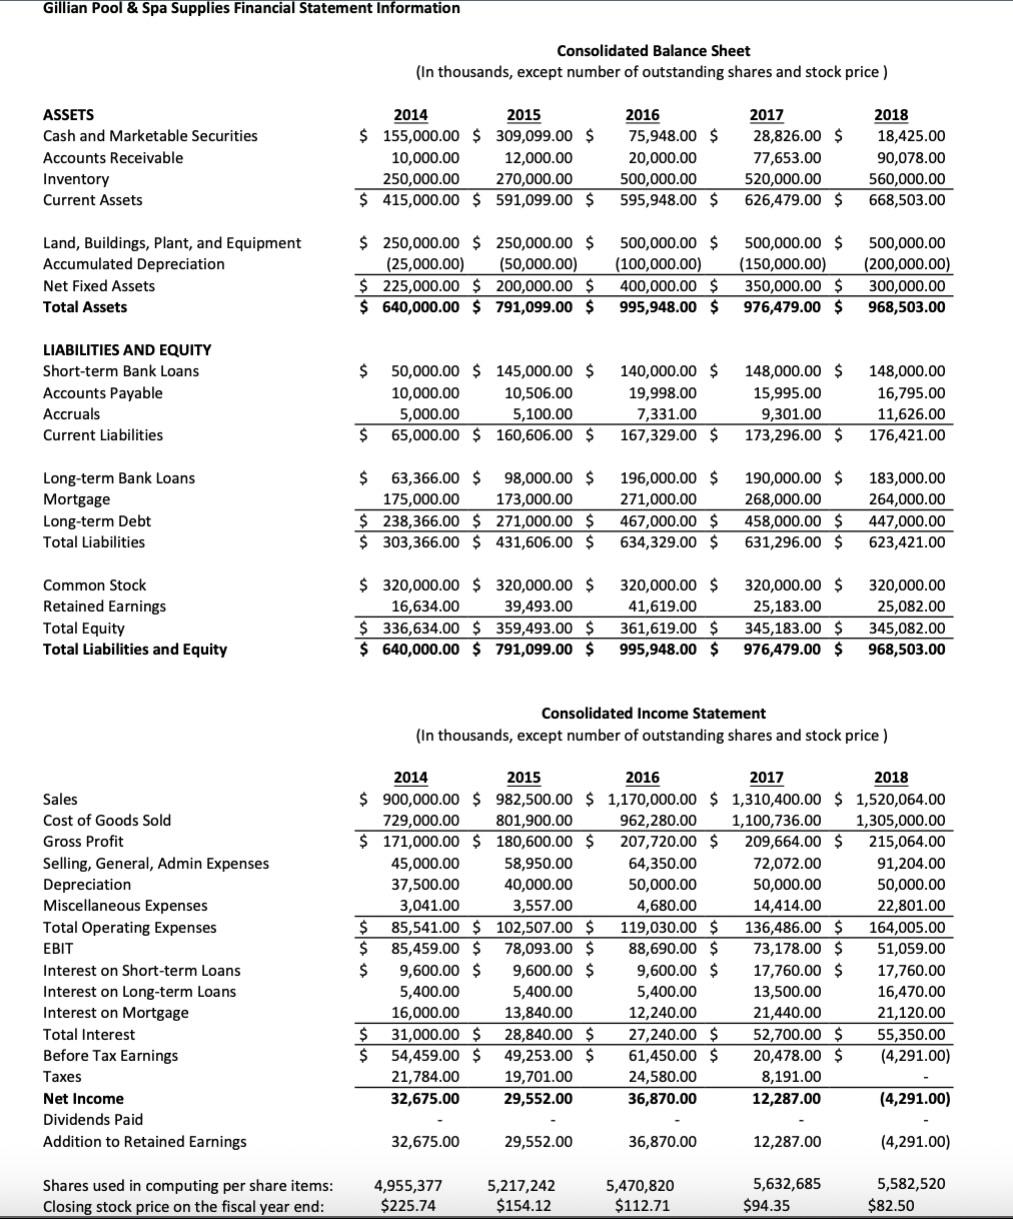
Gillian Pool and Spa Financial Statement Analysis The purpose of this project is to make students utilize the concepts and the tools we learn in class and apply them in real world problems. I acknowledge that there are both finance and non- finance students in the same class. Students who are majoring in finance will benefit from this project from a corporate financial management standpoint. Students who are not majoring in finance will benefit from this project from an investor standpoint. You may certainly use the same tools and techniques for small business financial management if you are planning start a business in the future. Note that most entrepreneurs who fail have the creativity, but they lack the necessary financial and money management skills. Please read the information below carefully for the details of the project, and don't hesitate to contact me if/when you have questions and/or need clarification. Project-1 consists of 2 steps: Step 1: Locate your file on Canvas and download it. Download the excel file for the company (Gillian Pool and Spa) financial statement information. Make sure you name your excel file as "StudentName_ExcelProject1" (e.g. AsligulErkan_Excel Project1). Also make sure to use excel for calculations. In other words, do not calculate the numbers using a calculator and then type into excel cells. Use MS Excel to make your calculations so that I can track your work and understand what had happened if there is a mistake. Step 2: The purpose of this step is to help students understand the importance of financial ratio analysis. Create a new excel worksheet in the same excel workbook and name it "Financial Ratios". Copy the financial statements from the first worksheet (named Financial Statements) and paste on the left side of your second worksheet (Financial Ratios). This will be the basis of your ratio calculations. For this step, first, you will calculate the following ratios for each of the five years: 1. Liquidity ratios: Current ratio, Quick ratio 2. Leverage ratios: D/E ratio, TIE ratio 3. Profitability ratios: Profit margin, ROA, ROE 4. Asset management ratios: a. Turnover ratios: Total asset turnover, Inventory turnover, Receivables turnover b. Days' sales ratios: Days' sales in inventory, Days' sales in receivables 5. Market value ratios: Earnings per share (EPS), Price-to-earnings (P/E) Financial ratios help us: 1. Focus on different aspects of the firm. 2. Understand how well or poorly the firm is doing in these aspects. Excel Project -1 3. Track how the firm's performance changing over time. After calculating the financial ratios, write one paragraph discussion for each of ratio group as a discussion of that aspect of the firm. I expect you to have 5 paragraphs in total to discuss 5 groups of ratios analyzing 5 aspects of the firm. This will conclude your Excel Project-1 - Financial Statement Analysis. Note 1: I pay attention to the format. Neat work goes a long way! Note 2: I share with you a video where I analyze Apple, Inc. financial statements as an example. This video will help you with formatting your project and discussion. Please note that copying discussions from this video to your file without any change or thought is considered violation of honor code. Furthermore, since you have a different company with different financial statement information, my discussion of Apple, Inc. will not be applicable to Gillian Pool and Spa. Use your judgement, interpretation, and wording in your discussions. Gillian Pool & Spa Supplies Financial Statement Information ASSETS Cash and Marketable Securities Accounts Receivable Inventory Current Assets Land, Buildings, Plant, and Equipment Accumulated Depreciation Net Fixed Assets Total Assets LIABILITIES AND EQUITY Short-term Bank Loans Accounts Payable Accruals Current Liabilities Long-term Bank Loans Mortgage Long-term Debt Total Liabilities Common Stock Retained Earnings Total Equity Total Liabilities and Equity Sales Cost of Goods Sold Gross Profit Selling, General, Admin Expenses Depreciation Miscellaneous Expenses Total Operating Expenses EBIT Interest on Short-term Loans Interest on Long-term Loans Interest on Mortgage Total Interest Before Tax Earnings Taxes Net Income Dividends Paid Addition to Retained Earnings Shares used in computing per share items: Closing stock price on the fiscal year end: 2014 2015 $ 155,000.00 $ 309,099.00 $ 10,000.00 12,000.00 250,000.00 270,000.00 $ 415,000.00 $ 591,099.00 $ $ 250,000.00 $ 250,000.00 $ (25,000.00) (50,000.00) $225,000.00 $ 200,000.00 $ $ 640,000.00 $ 791,099.00 $ Consolidated Balance Sheet (In thousands, except number of outstanding shares and stock price) $ 50,000.00 $ 145,000.00 $ 10,000.00 10,506.00 5,000.00 5,100.00 65,000.00 $ 160,606.00 $ $ $ $ $ 98,000.00 $ 63,366.00 $ 175,000.00 173,000.00 238,366.00 $ 271,000.00 $ 303,366.00 $ 431,606.00 $ $ 320,000.00 $ 320,000.00 $ 39,493.00 16,634.00 $336,634.00 $ 359,493.00 $ $ 640,000.00 $ 791,099.00 $ $ $ $ 2014 $ 900,000.00 $ 2015 982,500.00 $ 729,000.00 801,900.00 180,600.00 $ $ 171,000.00 $ 45,000.00 37,500.00 3,041.00 85,541.00 $ 102,507.00 $ 85,459.00 $ 78,093.00 $ 9,600.00 $ 9,600.00 $ 5,400.00 16,000.00 5,400.00 13,840.00 28,840.00 $ $ 31,000.00 $ $ 54,459.00 $ 49,253.00 $ 21,784.00 19,701.00 32,675.00 29,552.00 32,675.00 4,955,377 $225.74 58,950.00 40,000.00 3,557.00 29,552.00 2016 75,948.00 $ 20,000.00 500,000.00 595,948.00 $ 5,217,242 $154.12 500,000.00 $ (100,000.00) 400,000.00 $ 995,948.00 $ 196,000.00 $ 271,000.00 467,000.00 $ 634,329.00 $ 140,000.00 $ 148,000.00 $ 19,998.00 15,995.00 7,331.00 9,301.00 167,329.00 $ 173,296.00 $ 320,000.00 $ 41,619.00 361,619.00 $ 995,948.00 $ Consolidated Income Statement (In thousands, except number of outstanding shares and stock price) 119,030.00 $ 88,690.00 $ 9,600.00 $ 2017 28,826.00 $ 77,653.00 520,000.00 626,479.00 $ 5,400.00 12,240.00 27,240.00 $ 61,450.00 $ 24,580.00 36,870.00 500,000.00 $ (150,000.00) 350,000.00 $ 976,479.00 $ 36,870.00 5,470,820 $112.71 190,000.00 $ 268,000.00 458,000.00 $ 631,296.00 $ 320,000.00 $ 25,183.00 345,183.00 $ 976,479.00 $ 2016 2017 2018 1,170,000.00 $ 1,310,400.00 $ 1,520,064.00 962,280.00 1,100,736.00 1,305,000.00 207,720.00 $ 209,664.00 $ 215,064.00 64,350.00 72,072.00 91,204.00 50,000.00 50,000.00 50,000.00 4,680.00 14,414.00 22,801.00 164,005.00 51,059.00 17,760.00 16,470.00 21,120.00 55,350.00 (4,291.00) 136,486.00 $ 73,178.00 $ 17,760.00 $ 13,500.00 21,440.00 52,700.00 $ 20,478.00 $ 8,191.00 12,287.00 12,287.00 2018 18,425.00 90,078.00 560,000.00 668,503.00 5,632,685 500,000.00 (200,000.00) 300,000.00 968,503.00 $94.35 148,000.00 16,795.00 11,626.00 176,421.00 183,000.00 264,000.00 447,000.00 623,421.00 320,000.00 25,082.00 345,082.00 968,503.00 (4,291.00) (4,291.00) 5,582,520 $82.50 Gillian Pool and Spa Financial Statement Analysis The purpose of this project is to make students utilize the concepts and the tools we learn in class and apply them in real world problems. I acknowledge that there are both finance and non- finance students in the same class. Students who are majoring in finance will benefit from this project from a corporate financial management standpoint. Students who are not majoring in finance will benefit from this project from an investor standpoint. You may certainly use the same tools and techniques for small business financial management if you are planning start a business in the future. Note that most entrepreneurs who fail have the creativity, but they lack the necessary financial and money management skills. Please read the information below carefully for the details of the project, and don't hesitate to contact me if/when you have questions and/or need clarification. Project-1 consists of 2 steps: Step 1: Locate your file on Canvas and download it. Download the excel file for the company (Gillian Pool and Spa) financial statement information. Make sure you name your excel file as "StudentName_ExcelProject1" (e.g. AsligulErkan_Excel Project1). Also make sure to use excel for calculations. In other words, do not calculate the numbers using a calculator and then type into excel cells. Use MS Excel to make your calculations so that I can track your work and understand what had happened if there is a mistake. Step 2: The purpose of this step is to help students understand the importance of financial ratio analysis. Create a new excel worksheet in the same excel workbook and name it "Financial Ratios". Copy the financial statements from the first worksheet (named Financial Statements) and paste on the left side of your second worksheet (Financial Ratios). This will be the basis of your ratio calculations. For this step, first, you will calculate the following ratios for each of the five years: 1. Liquidity ratios: Current ratio, Quick ratio 2. Leverage ratios: D/E ratio, TIE ratio 3. Profitability ratios: Profit margin, ROA, ROE 4. Asset management ratios: a. Turnover ratios: Total asset turnover, Inventory turnover, Receivables turnover b. Days' sales ratios: Days' sales in inventory, Days' sales in receivables 5. Market value ratios: Earnings per share (EPS), Price-to-earnings (P/E) Financial ratios help us: 1. Focus on different aspects of the firm. 2. Understand how well or poorly the firm is doing in these aspects. Excel Project -1 3. Track how the firm's performance changing over time. After calculating the financial ratios, write one paragraph discussion for each of ratio group as a discussion of that aspect of the firm. I expect you to have 5 paragraphs in total to discuss 5 groups of ratios analyzing 5 aspects of the firm. This will conclude your Excel Project-1 - Financial Statement Analysis. Note 1: I pay attention to the format. Neat work goes a long way! Note 2: I share with you a video where I analyze Apple, Inc. financial statements as an example. This video will help you with formatting your project and discussion. Please note that copying discussions from this video to your file without any change or thought is considered violation of honor code. Furthermore, since you have a different company with different financial statement information, my discussion of Apple, Inc. will not be applicable to Gillian Pool and Spa. Use your judgement, interpretation, and wording in your discussions. Gillian Pool & Spa Supplies Financial Statement Information ASSETS Cash and Marketable Securities Accounts Receivable Inventory Current Assets Land, Buildings, Plant, and Equipment Accumulated Depreciation Net Fixed Assets Total Assets LIABILITIES AND EQUITY Short-term Bank Loans Accounts Payable Accruals Current Liabilities Long-term Bank Loans Mortgage Long-term Debt Total Liabilities Common Stock Retained Earnings Total Equity Total Liabilities and Equity Sales Cost of Goods Sold Gross Profit Selling, General, Admin Expenses Depreciation Miscellaneous Expenses Total Operating Expenses EBIT Interest on Short-term Loans Interest on Long-term Loans Interest on Mortgage Total Interest Before Tax Earnings Taxes Net Income Dividends Paid Addition to Retained Earnings Shares used in computing per share items: Closing stock price on the fiscal year end: 2014 2015 $ 155,000.00 $ 309,099.00 $ 10,000.00 12,000.00 250,000.00 270,000.00 $ 415,000.00 $ 591,099.00 $ $ 250,000.00 $ 250,000.00 $ (25,000.00) (50,000.00) $225,000.00 $ 200,000.00 $ $ 640,000.00 $ 791,099.00 $ Consolidated Balance Sheet (In thousands, except number of outstanding shares and stock price) $ 50,000.00 $ 145,000.00 $ 10,000.00 10,506.00 5,000.00 5,100.00 65,000.00 $ 160,606.00 $ $ $ $ $ 98,000.00 $ 63,366.00 $ 175,000.00 173,000.00 238,366.00 $ 271,000.00 $ 303,366.00 $ 431,606.00 $ $ 320,000.00 $ 320,000.00 $ 39,493.00 16,634.00 $336,634.00 $ 359,493.00 $ $ 640,000.00 $ 791,099.00 $ $ $ $ 2014 $ 900,000.00 $ 2015 982,500.00 $ 729,000.00 801,900.00 180,600.00 $ $ 171,000.00 $ 45,000.00 37,500.00 3,041.00 85,541.00 $ 102,507.00 $ 85,459.00 $ 78,093.00 $ 9,600.00 $ 9,600.00 $ 5,400.00 16,000.00 5,400.00 13,840.00 28,840.00 $ $ 31,000.00 $ $ 54,459.00 $ 49,253.00 $ 21,784.00 19,701.00 32,675.00 29,552.00 32,675.00 4,955,377 $225.74 58,950.00 40,000.00 3,557.00 29,552.00 2016 75,948.00 $ 20,000.00 500,000.00 595,948.00 $ 5,217,242 $154.12 500,000.00 $ (100,000.00) 400,000.00 $ 995,948.00 $ 196,000.00 $ 271,000.00 467,000.00 $ 634,329.00 $ 140,000.00 $ 148,000.00 $ 19,998.00 15,995.00 7,331.00 9,301.00 167,329.00 $ 173,296.00 $ 320,000.00 $ 41,619.00 361,619.00 $ 995,948.00 $ Consolidated Income Statement (In thousands, except number of outstanding shares and stock price) 119,030.00 $ 88,690.00 $ 9,600.00 $ 2017 28,826.00 $ 77,653.00 520,000.00 626,479.00 $ 5,400.00 12,240.00 27,240.00 $ 61,450.00 $ 24,580.00 36,870.00 500,000.00 $ (150,000.00) 350,000.00 $ 976,479.00 $ 36,870.00 5,470,820 $112.71 190,000.00 $ 268,000.00 458,000.00 $ 631,296.00 $ 320,000.00 $ 25,183.00 345,183.00 $ 976,479.00 $ 2016 2017 2018 1,170,000.00 $ 1,310,400.00 $ 1,520,064.00 962,280.00 1,100,736.00 1,305,000.00 207,720.00 $ 209,664.00 $ 215,064.00 64,350.00 72,072.00 91,204.00 50,000.00 50,000.00 50,000.00 4,680.00 14,414.00 22,801.00 164,005.00 51,059.00 17,760.00 16,470.00 21,120.00 55,350.00 (4,291.00) 136,486.00 $ 73,178.00 $ 17,760.00 $ 13,500.00 21,440.00 52,700.00 $ 20,478.00 $ 8,191.00 12,287.00 12,287.00 2018 18,425.00 90,078.00 560,000.00 668,503.00 5,632,685 500,000.00 (200,000.00) 300,000.00 968,503.00 $94.35 148,000.00 16,795.00 11,626.00 176,421.00 183,000.00 264,000.00 447,000.00 623,421.00 320,000.00 25,082.00 345,082.00 968,503.00 (4,291.00) (4,291.00) 5,582,520 $82.50Step by Step Solution
There are 3 Steps involved in it
Step: 1

Get Instant Access to Expert-Tailored Solutions
See step-by-step solutions with expert insights and AI powered tools for academic success
Step: 2

Step: 3

Ace Your Homework with AI
Get the answers you need in no time with our AI-driven, step-by-step assistance
Get Started


