 Please help I am lost thank you
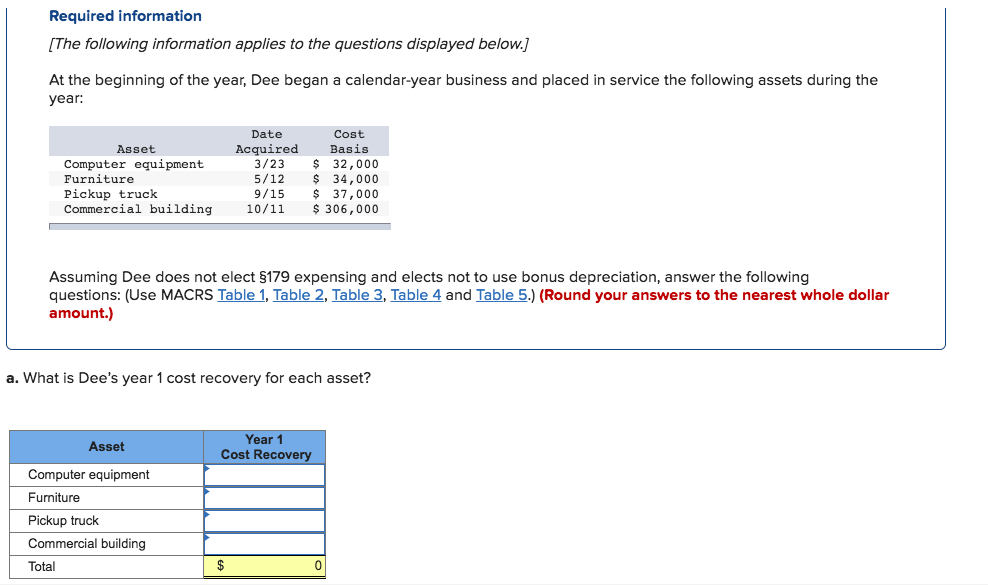
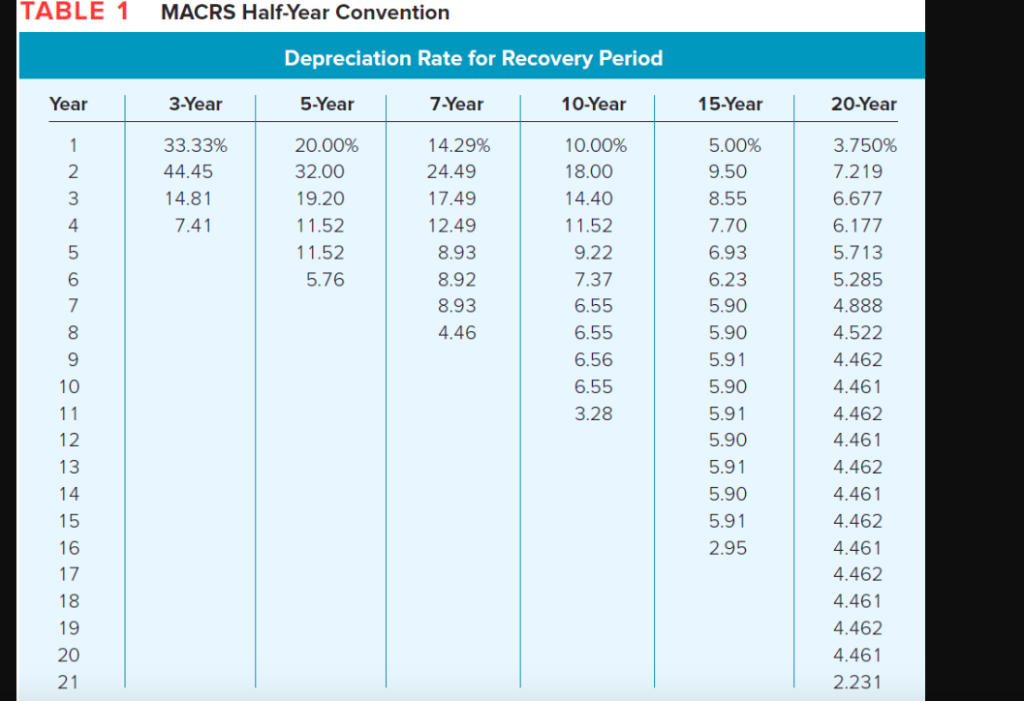
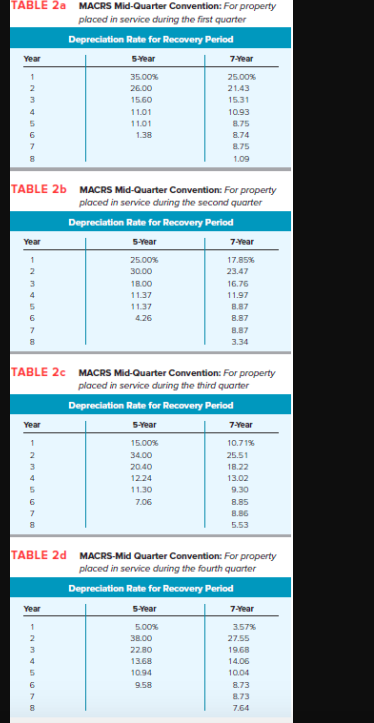
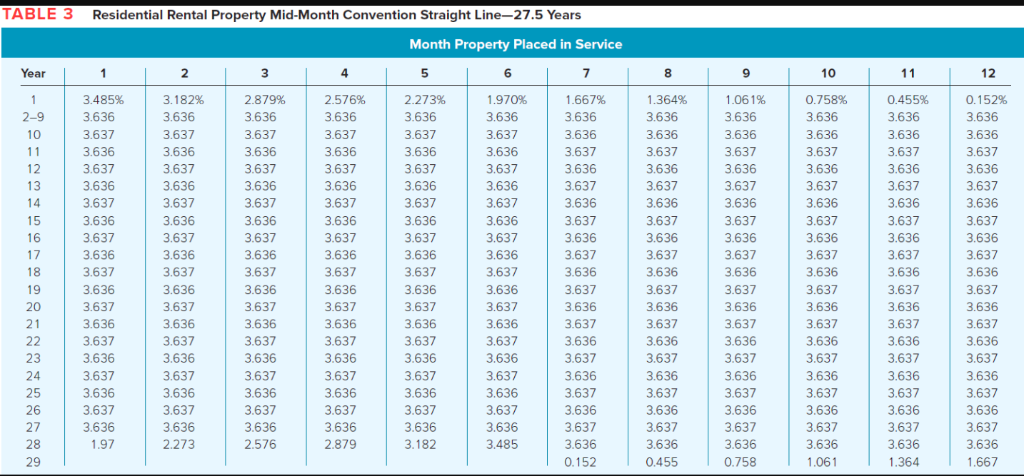
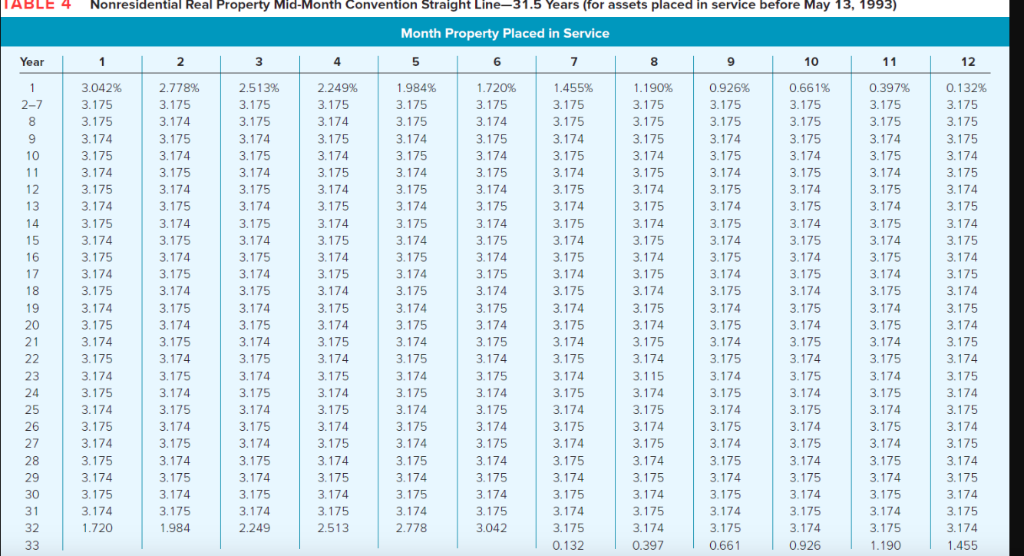
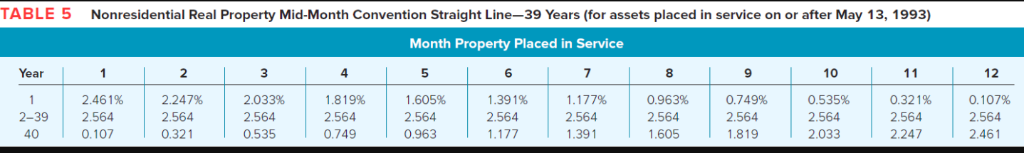
TABLE 1 MACRS Half-Year Convention Depreciation Rate for Recovery Period 5-Year 7 -Year 10-Year 15-Year 20-Year 3-Year 33.33% 44.45 14.8 Year 3.750% 7.219 6.677 10.00% 18.00 14.40 11.52 9.22 7.37 6.55 6.55 6.56 6.55 3.28 5.00% 9.50 8.55 7.70 6.93 6.23 5.90 5.90 5.91 5.90 5.91 5.90 5.91 5.90 5.91 2.95 14.29% 20.00% 32.00 19.20 11.52 11.52 5.76 24.49 2 3 4 17.49 2.49 8.93 8.92 8.93 4.46 7.41 5.713 5.285 4.888 4.522 4.462 4.461 4.462 4.461 4.462 4.461 4.462 4.461 4.462 4.461 4.462 4.461 2.231 6 9 10 12 16 17 18 20 TABLE 2a MACRS Mid-Quarter Convention: For property placed in service during the first quarter Depreciation Rate for Recovery Period 5-Year 7-Year 26.00 15.60 11.01 11.01 1.38 21.43 15.31 0.93 8.75 8.74 1.09 TABLE 2b MACRS Mid-Quarter Convention: For property placed in service during the second quarter Depreciation Rate for Recovery Period 7 -Year 17.85% 23.47 16.76 11.97 8.87 8.87 8.87 1B.0O 11.37 1.37 TABLE 2c MACRS Mid-Quarter Convention: For property placed in service during the third quarter Depreciation Rate for Recovery Period 7-Year 15.00% 10.71% 25.51 18.22 13.02 9.30 8.85 8.86 2040 1224 11.30 130 7.06 TABLE 2d MACRS-Mid Quarter Convention: For property placed in service during the fourth quarter Depreciation Rate for Recovery Period 7-Year 3.57% 22.80 1368 1094 958 27.55 19.68 14.06 10.04 8.73 873 7.64 2 667676767676767676767 533333333333333333333 166666666666666666666 0333333333333333333331 5667676767676767676764 46666 0333333333333333333331 761 766666666666666666666 0333333333333333333331 7676767676767676768 666666666666666666667 1333333333333333333330 3666666666666666666664 1333333333333333333330 767676767 6666666666666666666661 133333333333333333333 0. 7676767676767676765 3333333333333333338 966666666666666666664 133333333333333333333 26666666666666 233333333333333333333 667676767676767676769 233333333333333333332 198 36 37 36 37 36 37 36 37 36 37 36 37 36 37 36 37 36 37 36 76 866666666666666666665 233333333333333333332 67676767676767676763 2 833333333333333333337 166666666666666666662 333333333333333333332 567676767676767676767 I-833333333333333333339 46666666666666666666 01234567890123456789 2 2 555454545454545454545454545 3 3 3 3 3 3 3 3 3 3 3 3 3 3 3 3 3 3 3 3 3 3 3 3 3 3 1 55454545454545454545454545 0. 3 3 3 3 3 3 3 3 3 3 3 3 3 3 3 3 3 3 3 3 3 3 3 3 3 3 1 0333333333333333333333333330 6' 5 5 4 5 4 5 4 5 4 5 4 5 4 5 4 5 4 5 4 5 4 5 4 5 4 5 1 O. 3 3 3 3 3 3 3 3 3 3 3 3 3 3 3 3 3 3 3 3 3 3 3 3 3 3 0 555454545454545454545454547 1. 3 3 3 3 3 3 3 3 3 3 3 3 3 3 3 3 3 3 3 3 3 3 3 3 0 5554545454545454545454545452 1. 3 3 3 3 3 3 3 3 3 3 3 3 3 3 3 3 3 3 3 3 3 3. 3 3 0 5454545454545454 133333333333333333333333333 133333333333333333333333332 9% 54545454545454545454545453 233333333333333333333333332 55454545454545454545454549 233333333333333333333333332 54545454545454545454545454 23333333333333333333333333- 25545454545454545454545454 333333333333333333333333331 7 1-89 0123456789012345678 TABLE 5 Nonresidential Real Property Mid-Month Convention Straight Line-39 Years (for assets placed in service on or after May 13, 1993) Month Property Placed in Service Year 5 12 2.461% 2.564 0.107 2 2.247% 2.564 0.321 2.033% 2.564 0.535 1.819% 2.564 0.749 1.605% 2.564 0.963 6 1.391% 2.564 1.177% 2.564 1.391 0.963% 2.564 1.605 0.749% 2.564 1.819 0.535% 2.564 2.033 0.321% 2.564 2.247 0.1 07% 2.564 2.461 2-39 40 Required informatio [The following information applies to the questions displayed below.] At the beginning of the year, Dee began a calendar-year business and placed in service the following assets during the year Date Cost Basis Asset Acquired Computer equipment Furniture Pickup truck Commercial building 3/23 32,000 5/12 34,000 9/15 37,000 10/11 306,000 Assuming Dee does not elect 5179 expensing and elects not to use bonus depreciation, answer the following questions: (Use MACRS Table 1, Table 2, Table 3, Table 4 and Table 5.) (Round your answers to the nearest whole dollar amount.) a. What is Dee's year 1 cost recovery for each asset? Year 1 Cost Recove Asset Computer equipment Furniture Pickup truck Commercial building Total