

Question
Please help in calculating below 1.Operating profit margin 2. Net profit margin 3. Earnings Per share 4. Return of equity 5. Inventory turnover ratio (if
Please help in calculating below
1.Operating profit margin 2. Net profit margin 3. Earnings Per share 4. Return of equity 5. Inventory turnover ratio (if manufacturing company) or Total assets turnover (if service company) 6.Times interest earned ratio 7.Price/Earnings Ratio (Take current days market price from google) 8.Days receivables (Debt to Equity ratio if days receivables not available)
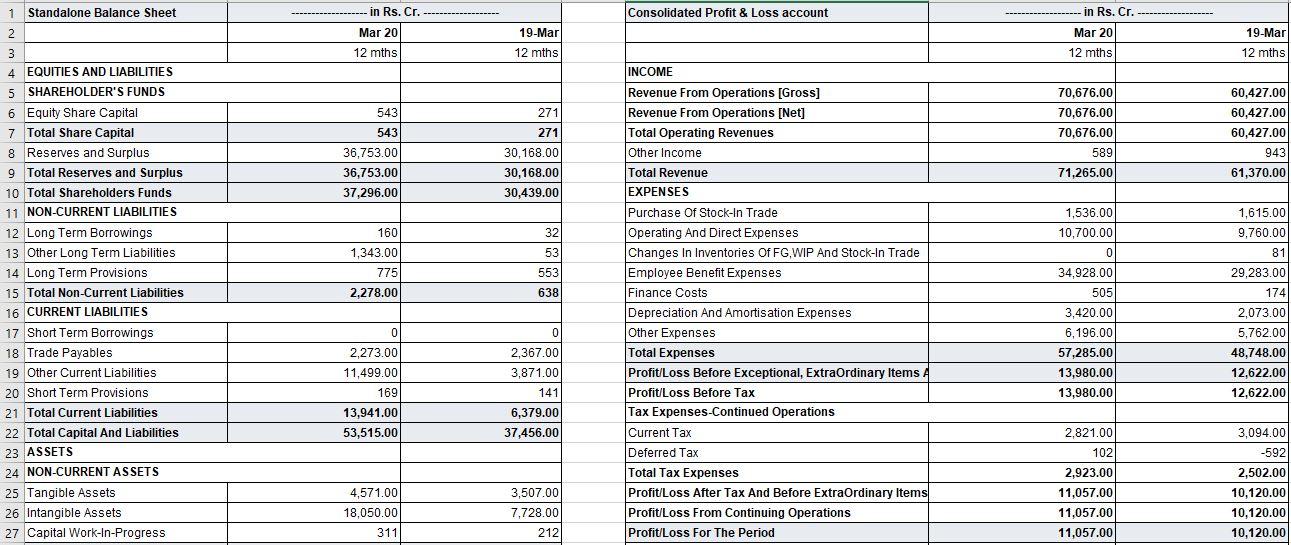
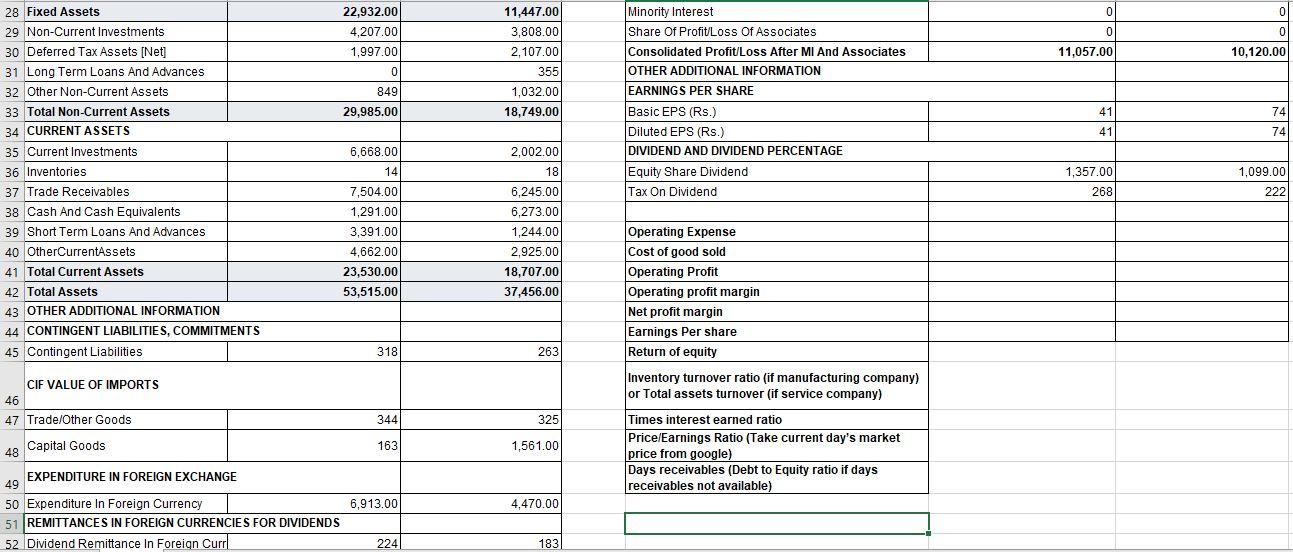
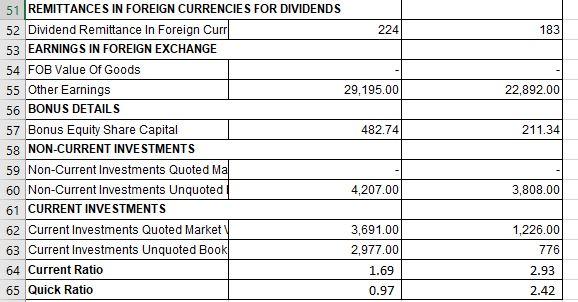
1 1 Standalone Balance Sheet Consolidated Profit & Loss account -------- 2 in Rs. Cr. Mar 20 12 mths 19-Mar 12 mths in Rs. Cr. Mar 20 12 mths 19-Mar 12 mths 543 543 36,753.00 36,753.00 37,296.00 271 271 30,168.00 30,168.00 30,439.00 70,676.00 70,676.00 70,676.00 589 71,265.00 60,427.00 60,427.00 60,427.00 943 61,370.00 1,536.00 10,700.00 160 32 53 553 1,343.00 775 0 3 4 EQUITIES AND LIABILITIES 5 SHAREHOLDER'S FUNDS 6 Equity Share Capital 7 Total Share Capital 8 Reserves and Surplus 9 Total Reserves and Surplus 10 Total Shareholders Funds 11 NON-CURRENT LIABILITIES 12 Long Term Borrowings 13 Other Long Term Liabilities 14 Long Term Provisions 15 Total Non-Current Liabilities 16 CURRENT LIABILITIES 17 Short Term Borrowings 18 Trade Payables 19 Other Current Liabilities 20 Short Term Provisions 21 Total Current Liabilities 22 Total Capital And Liabilities 23 ASSETS 24 NON-CURRENT ASSETS - 25 Tangible Assets 26 Intangible Assets 27 Capital Work-In-Progress 2,278.00 638 INCOME Revenue From Operations [Gross] Revenue From Operations (Net] Total Operating Revenues Other Income Total Revenue EXPENSES Purchase of Stock-In Trade Operating And Direct Expenses Changes In Inventories Of FG WIP And Stock-In Trade Employee Benefit Expenses Finance Costs Depreciation And Amortisation Expenses Other Expenses Total Expenses Profit/Loss Before Exceptional, Extraordinary Items A Profit/Loss Before Tax Tax Expenses-Continued Operations Current Tax Deferred Tax Total Tax Expenses Profit/Loss After Tax And Before Extraordinary Items Profit/Loss From Continuing Operations Profit/Loss For The Period 1,615.00 9,760.00 81 29,283.00 1741 2,073.00 5,762.000 48,748.00 12,622.00 12,622.00 01 2,273.00 11,499.00 169 13,941.00 53,515.00 34,928.00 505 3,420.00 6,196.00 57,285.00 13,980.00 13,980.00 0 2,367.00 3,871.00 141 6,379.00 37,456.00 2,821.00 1021 2,923.00 11,057.00 11,057.00 11,057.000 3,094.00 -592 2,502.00 10,120.00 10,120.00 10,120.00 4,571.00 18,050.00 311 3,507.00 7,728.00 212 0 0 22,932.00 4,207.00 1,997.00 0 0 0 11,057.00 10,120.00 11,447.00 3,808.00 2,107.00 355 1,032.00 18,749.00 0 849 29,985.00 Minority Interest Share Of Profit/Loss Of Associates Consolidated Profit/Loss After MI And Associates OTHER ADDITIONAL INFORMATION EARNINGS PER SHARE Basic EPS (Rs.) Diluted EPS (Rs.) DIVIDEND AND DIVIDEND PERCENTAGE Equity Share Dividend Tax On Dividend 41 74 74 28 Fixed Assets 29 Non-Current Investments 30 Deferred Tax Assets [Net] 31 Long Term Loans And Advances 32 Other Non-Current Assets 33 Total Non-Current Assets 34 CURRENT ASSETS 35 Current Investments 36 Inventories 37 Trade Receivables 38 Cash And Cash Equivalents 39 Short Term Loans And Advances 40 OtherCurrentAssets 41 Total Current Assets 42 Total Assets 43 OTHER ADDITIONAL INFORMATION 44 CONTINGENT LIABILITIES, COMMITMENTS 45 Contingent Liabilities 41 1,357.00 268 1,099.00 222 6,668.00 141 7,504.00 1,291.00 3.391.00 4,662.00 23,530.00 53,515.00 2.002.00 18 6,245.00 6,273.00 1,244.00 2,925.00 18,707.00 37,456.00 Operating Expense Cost of good sold Operating Profit Operating profit margin Net profit margin Earnings Per share Return of equity Inventory turnover ratio (if manufacturing company) or Total assets turnover (if service company) 318 263 CIF VALUE OF IMPORTS 46 47 Trade/Other Goods 344 325 Capital Goods 48 163 1,561.00 Times interest earned ratio Price/Earnings Ratio (Take current day's market price from google) Days receivables (Debt to Equity ratio if days receivables not available) EXPENDITURE IN FOREIGN EXCHANGE 49 50 Expenditure In Foreign Currency 51 REMITTANCES IN FOREIGN CURRENCIES FOR DIVIDENDS 52 Dividend Remittance In Foreign Curr 6,913.00 4,470.00 224 183 183 22,892.00 211.34 51 REMITTANCES IN FOREIGN CURRENCIES FOR DIVIDENDS 52 Dividend Remittance In Foreign Curr 224 53 EARNINGS IN FOREIGN EXCHANGE 54 FOB Value of Goods 55 Other Earnings 29,195.00 56 BONUS DETAILS 57 Bonus Equity Share Capital 482.74 58 NON-CURRENT INVESTMENTS 59 Non-Current Investments Quoted Ma 60 Non-Current Investments Unquoted 4,207.000 61 CURRENT INVESTMENTS 62 Current Investments Quoted Market 3,691.00 63 Current Investments Unquoted Book 2,977.00 64 Current Ratio 1.69 65 Quick Ratio 0.97 3,808.00 1,226.00 776 2.93 2.42 1 1 Standalone Balance Sheet Consolidated Profit & Loss account -------- 2 in Rs. Cr. Mar 20 12 mths 19-Mar 12 mths in Rs. Cr. Mar 20 12 mths 19-Mar 12 mths 543 543 36,753.00 36,753.00 37,296.00 271 271 30,168.00 30,168.00 30,439.00 70,676.00 70,676.00 70,676.00 589 71,265.00 60,427.00 60,427.00 60,427.00 943 61,370.00 1,536.00 10,700.00 160 32 53 553 1,343.00 775 0 3 4 EQUITIES AND LIABILITIES 5 SHAREHOLDER'S FUNDS 6 Equity Share Capital 7 Total Share Capital 8 Reserves and Surplus 9 Total Reserves and Surplus 10 Total Shareholders Funds 11 NON-CURRENT LIABILITIES 12 Long Term Borrowings 13 Other Long Term Liabilities 14 Long Term Provisions 15 Total Non-Current Liabilities 16 CURRENT LIABILITIES 17 Short Term Borrowings 18 Trade Payables 19 Other Current Liabilities 20 Short Term Provisions 21 Total Current Liabilities 22 Total Capital And Liabilities 23 ASSETS 24 NON-CURRENT ASSETS - 25 Tangible Assets 26 Intangible Assets 27 Capital Work-In-Progress 2,278.00 638 INCOME Revenue From Operations [Gross] Revenue From Operations (Net] Total Operating Revenues Other Income Total Revenue EXPENSES Purchase of Stock-In Trade Operating And Direct Expenses Changes In Inventories Of FG WIP And Stock-In Trade Employee Benefit Expenses Finance Costs Depreciation And Amortisation Expenses Other Expenses Total Expenses Profit/Loss Before Exceptional, Extraordinary Items A Profit/Loss Before Tax Tax Expenses-Continued Operations Current Tax Deferred Tax Total Tax Expenses Profit/Loss After Tax And Before Extraordinary Items Profit/Loss From Continuing Operations Profit/Loss For The Period 1,615.00 9,760.00 81 29,283.00 1741 2,073.00 5,762.000 48,748.00 12,622.00 12,622.00 01 2,273.00 11,499.00 169 13,941.00 53,515.00 34,928.00 505 3,420.00 6,196.00 57,285.00 13,980.00 13,980.00 0 2,367.00 3,871.00 141 6,379.00 37,456.00 2,821.00 1021 2,923.00 11,057.00 11,057.00 11,057.000 3,094.00 -592 2,502.00 10,120.00 10,120.00 10,120.00 4,571.00 18,050.00 311 3,507.00 7,728.00 212 0 0 22,932.00 4,207.00 1,997.00 0 0 0 11,057.00 10,120.00 11,447.00 3,808.00 2,107.00 355 1,032.00 18,749.00 0 849 29,985.00 Minority Interest Share Of Profit/Loss Of Associates Consolidated Profit/Loss After MI And Associates OTHER ADDITIONAL INFORMATION EARNINGS PER SHARE Basic EPS (Rs.) Diluted EPS (Rs.) DIVIDEND AND DIVIDEND PERCENTAGE Equity Share Dividend Tax On Dividend 41 74 74 28 Fixed Assets 29 Non-Current Investments 30 Deferred Tax Assets [Net] 31 Long Term Loans And Advances 32 Other Non-Current Assets 33 Total Non-Current Assets 34 CURRENT ASSETS 35 Current Investments 36 Inventories 37 Trade Receivables 38 Cash And Cash Equivalents 39 Short Term Loans And Advances 40 OtherCurrentAssets 41 Total Current Assets 42 Total Assets 43 OTHER ADDITIONAL INFORMATION 44 CONTINGENT LIABILITIES, COMMITMENTS 45 Contingent Liabilities 41 1,357.00 268 1,099.00 222 6,668.00 141 7,504.00 1,291.00 3.391.00 4,662.00 23,530.00 53,515.00 2.002.00 18 6,245.00 6,273.00 1,244.00 2,925.00 18,707.00 37,456.00 Operating Expense Cost of good sold Operating Profit Operating profit margin Net profit margin Earnings Per share Return of equity Inventory turnover ratio (if manufacturing company) or Total assets turnover (if service company) 318 263 CIF VALUE OF IMPORTS 46 47 Trade/Other Goods 344 325 Capital Goods 48 163 1,561.00 Times interest earned ratio Price/Earnings Ratio (Take current day's market price from google) Days receivables (Debt to Equity ratio if days receivables not available) EXPENDITURE IN FOREIGN EXCHANGE 49 50 Expenditure In Foreign Currency 51 REMITTANCES IN FOREIGN CURRENCIES FOR DIVIDENDS 52 Dividend Remittance In Foreign Curr 6,913.00 4,470.00 224 183 183 22,892.00 211.34 51 REMITTANCES IN FOREIGN CURRENCIES FOR DIVIDENDS 52 Dividend Remittance In Foreign Curr 224 53 EARNINGS IN FOREIGN EXCHANGE 54 FOB Value of Goods 55 Other Earnings 29,195.00 56 BONUS DETAILS 57 Bonus Equity Share Capital 482.74 58 NON-CURRENT INVESTMENTS 59 Non-Current Investments Quoted Ma 60 Non-Current Investments Unquoted 4,207.000 61 CURRENT INVESTMENTS 62 Current Investments Quoted Market 3,691.00 63 Current Investments Unquoted Book 2,977.00 64 Current Ratio 1.69 65 Quick Ratio 0.97 3,808.00 1,226.00 776 2.93 2.42
Step by Step Solution
There are 3 Steps involved in it
Step: 1

Get Instant Access to Expert-Tailored Solutions
See step-by-step solutions with expert insights and AI powered tools for academic success
Step: 2

Step: 3
Ace Your Homework with AI
Get the answers you need in no time with our AI-driven, step-by-step assistance
Get Started
Islamic Banks Positioning Study Regulatory Specificities And Audit Particularities
Authors: Hassen BEN OUHIBA
1st Edition
6206279790, 978-6206279792