Please help me answer the following question from 12 (a) to 12 (c). Thank you
Question 12
Financial statement chart
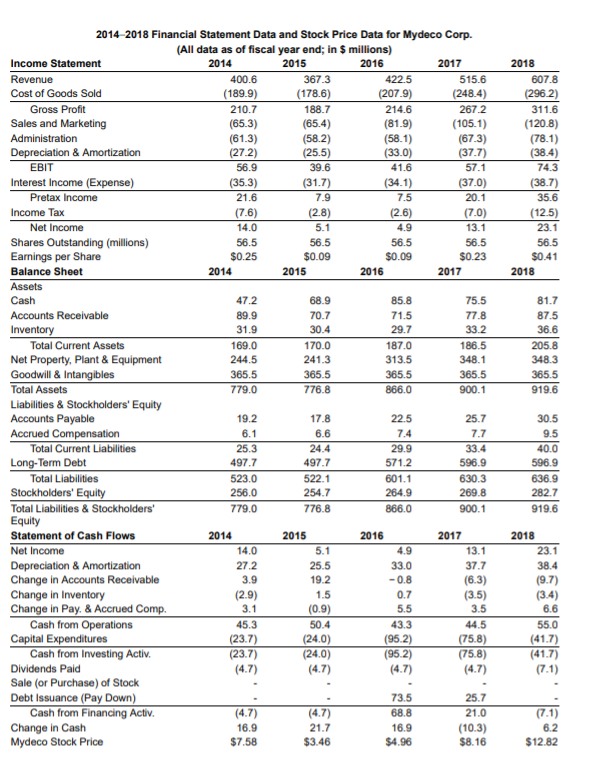
Consider the financial statement data and stock price data for Mydeco Corp. Click the icon to view the financial statement and stock price data. a. By what percentage did Mydeco's revenues grow each year from 2015 to 2018? b. By what percentage did net income grow each year? c. Why might the growth rates of revenues and net income differ? a. By what percentage did Mydeco's revenues grow each year from 2015 to 2018? The revenues growth for year 2015 is %. (Round to two decimal places.) 2018 607.8 (296.2) 311.6 (120.8) (78.1) (38.4) 74.3 (38.7) 35.6 (12.5) 23.1 56.5 $0.41 2018 2014-2018 Financial Statement Data and Stock Price Data for Mydeco Corp. (All data as of fiscal year end; in $ millions) Income Statement 2014 2015 2016 2017 Revenue 400.6 367.3 422.5 515.6 Cost of Goods Sold (189.9) (178.6) (207.9) (248.4) Gross Profit 210.7 188.7 214.6 2672 Sales and Marketing (65.3) (65.4) (81.9) (105.1) Administration (61.3) (58.2) (58.1) (67.3) Depreciation & Amortization (272) (25.5) (33.0) (37.7) EBIT 56.9 39.6 41.6 57.1 Interest Income (Expense) (35.3) (31.7) (34.1) (37.0) Pretax Income 21.6 7.9 7.5 20.1 Income Tax (7.6) (2.8) (2.6) (7.0) Net Income 14.0 5.1 4.9 13.1 Shares Outstanding (millions) 56.5 56.5 56.5 56.5 Earnings per Share $0.25 $0.09 $0.09 $0.23 Balance Sheet 2014 2015 2016 2017 Assets Cash 47.2 68.9 85.8 75.5 Accounts Receivable 89.9 70.7 71.5 77.8 Inventory 31.9 30.4 29.7 33.2 Total Current Assets 169.0 170.0 187.0 186.5 Net Property, Plant & Equipment 244.5 241.3 313.5 348.1 Goodwill & Intangibles 365.5 365.5 365.5 365.5 Total Assets 779.0 776.8 866.0 900.1 Liabilities & Stockholders' Equity Accounts Payable 19.2 17.8 22.5 25.7 Accrued Compensation 6.1 6.6 7.4 7.7 Total Current Liabilities 25.3 24.4 33.4 Long-Term Debt 497.7 497.7 571.2 596.9 Total Liabilities 523.0 522.1 601.1 630.3 Stockholders' Equity 256.0 254.7 264.9 269.8 Total Liabilities & Stockholders' 779.0 776.8 866.0 900.1 Equity Statement of Cash Flows 2014 2015 2016 2017 Net Income 14.0 5.1 4.9 13.1 Depreciation & Amortization 27.2 25.5 33.0 37.7 Change in Accounts Receivable 3.9 19.2 -0.8 (6.3) Change in Inventory (2.9) 1.5 0.7 (3.5) Change in Pay. & Accrued Comp. 3.1 (0.9) 5.5 3.5 Cash from Operations 45.3 43.3 44.5 Capital Expenditures (23.7) (24.0) (95.2) (75.8) Cash from Investing Activ. (23.7) (24.0) (95.2) (75.8) Dividends Paid (4.7) (4.7) (4.7) (4.7) Sale (or Purchase) of Stock Debt Issuance (Pay Down) 73.5 25.7 Cash from Financing Activ. (4.7) (4.7) 68.8 21.0 Change in Cash 16.9 21.7 16.9 (10.3) Mydeco Stock Price $7.58 $3.46 $4.96 $8.16 81.7 87.5 36.6 205.8 348.3 365.5 919.6 29.9 30.5 9.5 40.0 596.9 636.9 282.7 919.6 2018 23.1 38.4 (9.7) (3.4) 6.6 50.4 55.0 (41.7) (41.7) (7.1) (7.1) 6.2 $12.82