

Answered step by step
Verified Expert Solution
Question
1 Approved Answer
Use this excel to answer question Hello i would like help on Question D. It is based on the excel sheet above. Any help is
Use this excel to answer question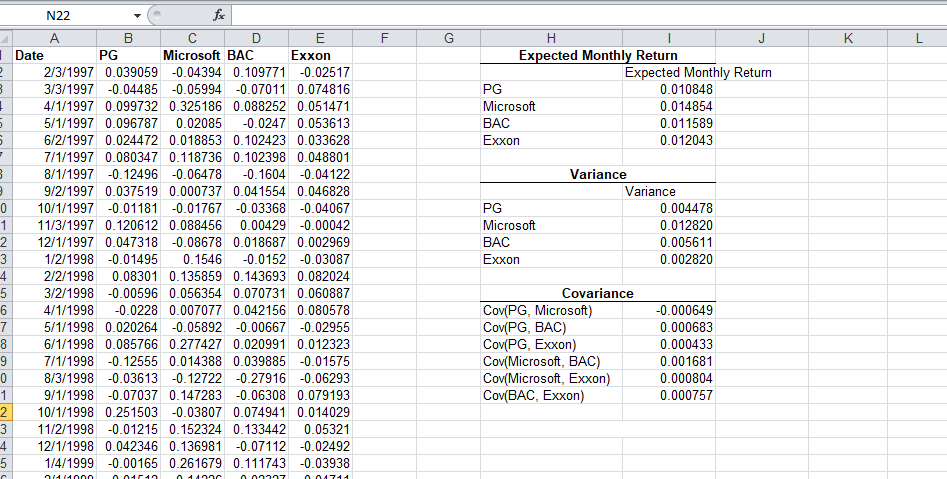
Hello i would like help on Question D. It is based on the excel sheet above. Any help is good. I will give you thumbs up!
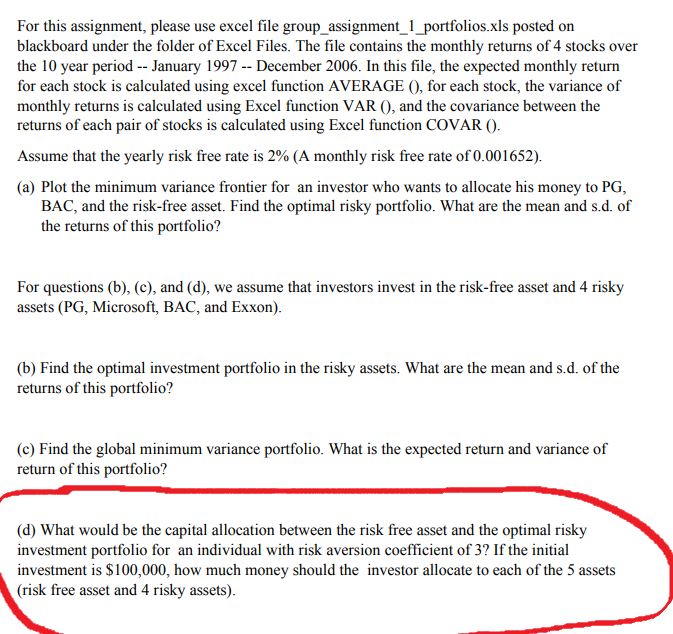
Microsoft BAC Expected Monthly Return 8 2/3/1997 0.039059 -0.04394 0.109771-0.02517 3/3/1997 -0.04485 -0.05994 -0.07011 0.074816 4/1/1997 0.099732 0.3251860.088252 0.051471 5/1/1997 0.096787 0.02085-0.0247 0.053613 6/2/1997 0.024472 0.018853 0.102423 0.033628 7/1/1997 0.080347 0.118736 0.1023980.048801 8/1/1997 -0.12496-0.06478 -0.1604 0.04122 9/2/1997 0.037519 0.000737 0.041554 0.046828 0 10/1/1997 0.01181 0.017670.03368 0.04067 1 11/3/19970.120612 0.088456 0.00429 -0.00042 2 12/1/1997 0.047318 -0.08678 0.018687 0.002969 1/2/1998 0.01495 0.1546 0.0152 0.03087 2/2/1998 0.08301 0.135859 0.143693 0.082024 3/2/1998-0.00596 0.056354 0.070731 0.060887 4/1/1998 -0.0228 0.007077 0.042156 0.080578 5/1/1998 0.020264 -0.05892 -0.00667 -0.02955 6/1/1998 0.085766 0.277427 0.020991 0.012323 7/1/1998-0.12555 0.014388 0.039885 -0.01575 8/3/19980.03613 -0.12722 -0.27916 0.06293 9/1/1998-0.07037 0.147283 -0.06308 0.079193 2 10/1/1998 0.251503 -0.03807 0.074941 0.014029 3 11/2/1998 -0.01215 0.152324 0.133442 0.05321 12/1/1998 0.042346 0.13698-0.07112 -0.02492 1/4/19990.00165 0.261679 0.111743 0.03938 Expected Monthly Return Microsoft 0.011589 Variance Microsoft Covariance Cov(PG, Microsoft) 0.000683 0.001681 0.000757 on Cov(Microsoft, BAC) icrosoft, Exxon) 1 For this assignment, please use excel file group_assignment_1_portfolios.xls posted on blackboard under the folder of Excel Files. The file contains the monthly returns of 4 stocks over the 10 year period -- January 1997 -- December 2006. In this file, the expected monthly return for each stock is calculated using excel function AVERAGE 0, for each stock, the variance of monthly returns is calculated using Excel function VAR O, and the covariance between the returns of each pair of stocks is calculated using Excel function COVAR O Assume that the yearly risk free rate is 2% (A monthly risk free rate of 0.001652) (a) Plot the minimum variance frontier for an investor who wants to allocate his money to PG, BAC, and the risk-free asset. Find the optimal risky portfolio. What are the mean and s.d. of the returns of this portfolio? For questions (b), (c), and (d), we assume that investors invest in the risk-free asset and 4 risky assets (PG, Microsoft, BAC, and Exxon). (b) Find the optimal investment portfolio in the risky assets. What are the mean and s.d. of the returns of this portfolio? (c) Find the global minimum variance portfolio. What is the expected return and variance of return of this portfolio? (d) What would be the capital allocation between the risk free asset and the optimal risky investment portfolio for an individual with risk aversion coefficient of 3? If the initial investment is $100,000, how much money should the investor allocate to each of the 5 assets (risk free asset and 4 risky assets). Microsoft BAC Expected Monthly Return 8 2/3/1997 0.039059 -0.04394 0.109771-0.02517 3/3/1997 -0.04485 -0.05994 -0.07011 0.074816 4/1/1997 0.099732 0.3251860.088252 0.051471 5/1/1997 0.096787 0.02085-0.0247 0.053613 6/2/1997 0.024472 0.018853 0.102423 0.033628 7/1/1997 0.080347 0.118736 0.1023980.048801 8/1/1997 -0.12496-0.06478 -0.1604 0.04122 9/2/1997 0.037519 0.000737 0.041554 0.046828 0 10/1/1997 0.01181 0.017670.03368 0.04067 1 11/3/19970.120612 0.088456 0.00429 -0.00042 2 12/1/1997 0.047318 -0.08678 0.018687 0.002969 1/2/1998 0.01495 0.1546 0.0152 0.03087 2/2/1998 0.08301 0.135859 0.143693 0.082024 3/2/1998-0.00596 0.056354 0.070731 0.060887 4/1/1998 -0.0228 0.007077 0.042156 0.080578 5/1/1998 0.020264 -0.05892 -0.00667 -0.02955 6/1/1998 0.085766 0.277427 0.020991 0.012323 7/1/1998-0.12555 0.014388 0.039885 -0.01575 8/3/19980.03613 -0.12722 -0.27916 0.06293 9/1/1998-0.07037 0.147283 -0.06308 0.079193 2 10/1/1998 0.251503 -0.03807 0.074941 0.014029 3 11/2/1998 -0.01215 0.152324 0.133442 0.05321 12/1/1998 0.042346 0.13698-0.07112 -0.02492 1/4/19990.00165 0.261679 0.111743 0.03938 Expected Monthly Return Microsoft 0.011589 Variance Microsoft Covariance Cov(PG, Microsoft) 0.000683 0.001681 0.000757 on Cov(Microsoft, BAC) icrosoft, Exxon) 1 For this assignment, please use excel file group_assignment_1_portfolios.xls posted on blackboard under the folder of Excel Files. The file contains the monthly returns of 4 stocks over the 10 year period -- January 1997 -- December 2006. In this file, the expected monthly return for each stock is calculated using excel function AVERAGE 0, for each stock, the variance of monthly returns is calculated using Excel function VAR O, and the covariance between the returns of each pair of stocks is calculated using Excel function COVAR O Assume that the yearly risk free rate is 2% (A monthly risk free rate of 0.001652) (a) Plot the minimum variance frontier for an investor who wants to allocate his money to PG, BAC, and the risk-free asset. Find the optimal risky portfolio. What are the mean and s.d. of the returns of this portfolio? For questions (b), (c), and (d), we assume that investors invest in the risk-free asset and 4 risky assets (PG, Microsoft, BAC, and Exxon). (b) Find the optimal investment portfolio in the risky assets. What are the mean and s.d. of the returns of this portfolio? (c) Find the global minimum variance portfolio. What is the expected return and variance of return of this portfolio? (d) What would be the capital allocation between the risk free asset and the optimal risky investment portfolio for an individual with risk aversion coefficient of 3? If the initial investment is $100,000, how much money should the investor allocate to each of the 5 assets (risk free asset and 4 risky assets)Step by Step Solution
There are 3 Steps involved in it
Step: 1

Get Instant Access to Expert-Tailored Solutions
See step-by-step solutions with expert insights and AI powered tools for academic success
Step: 2

Step: 3
Ace Your Homework with AI
Get the answers you need in no time with our AI-driven, step-by-step assistance
Get Started
Single Stock Futures For Small Speculators
Authors: Noble Drakoln
1st Edition
0966624564, 978-0966624564