Please help me
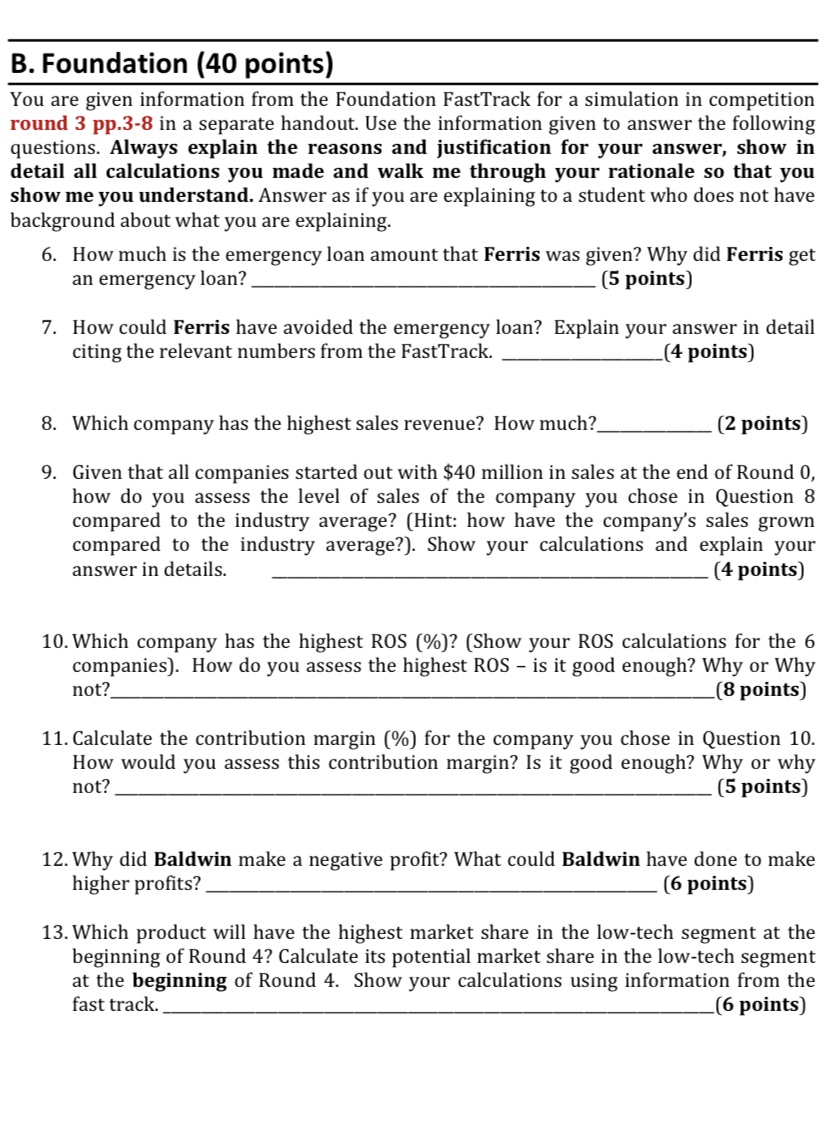
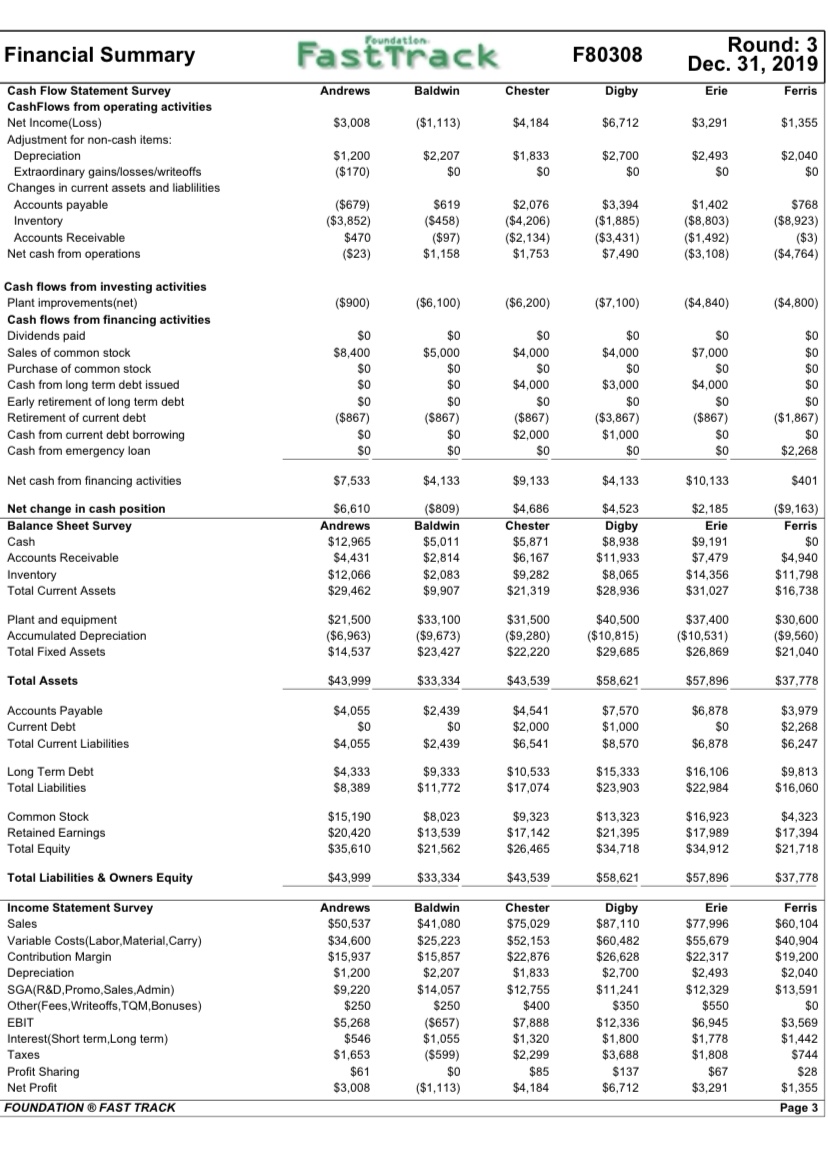
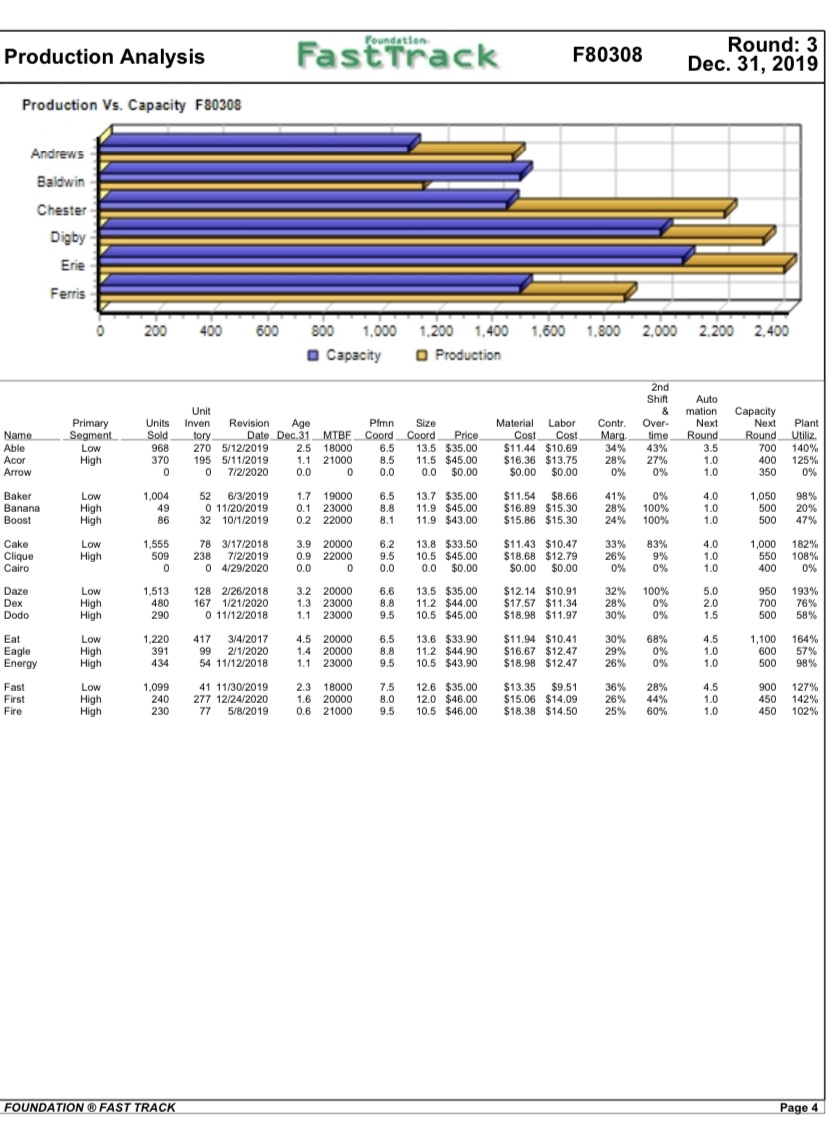
B. Foundation (40 points) You are given information from the Foundation FastTrack for a simulation in competition round 3 pp.3-8 in a separate handout. Use the information given to answer the following questions. Always explain the reasons and justication for your answer, show in detail all calculations you made and walk me through your rationale so that you show me you understand. Answer as ifyou are explaining to a student who does not have background about what you are explaining. 6. How much is the emergency loan amount that Ferris was given? Why did Ferris get an emergency loan? [5 points] '7. How could Ferris have avoided the emergency loan? Explain your answer in detail citing the relevant numbers from the Fast'l'rack. [4- points] 8. Which company has the highest sales revenue? How much? [2 points) 9. Given that all companies started out with $40 million in sales at the end ofRound {1, how do you assess the level of sales of the company you chose in Question 8 compared to the industry average? [Hintz how have the company's sales grown compared to the industry average?}. Show your calculations and explain your answer in details. [4 points] 10.Which company has the highest R05 ['36]? [Show your ROS calculations for the 6 companies]. How do you assess the highest R05 is it good enough? Why or Why not? [3 points] 11. Calculate the contribution margin [96] for the company you chose in Question 10. How would you assess this contribution margin? Is it good enough? Why or why not? [5 points) 12.Why did Baldwin make a negative prot? What could Baldwin have done to make higher prots? [6 points) 13.Which product will have the highest market share in the low-tech segment at the beginning of Round 4? Calculate its potential market share in the low-tech segment at the beginning of Round 4-. Show your calculations using information from the fast track. [6 points) Financial Summary FastTrack F80308 Round: 3 Dec. 31, 2019 Cash Flow Statement Survey Andrews Baldwin Digby Erie Ferris CashFlows from operating activities Net Income(Loss) $3,008 $4,184 $6,712 $3,291 $1,355 Adjustment for non-cash items: Depreciation $1,200 $2,207 $1,833 $2,700 $2,493 $2,040 Extraordinary gains/losses/writeoffs ($170) $0 $0 SO Changes in current assets and liablilities Accounts payable ($679) $619 $2,076 $3,394 $1,402 Inventory ($3,852) ($458) ($4,206) ($1,885) ($8,803 ($8,923) Accounts Receivable $470 ($97) ($2,134) ($3,431) ($1,492) ($3 Net cash from operations $1, 158 $1,753 ($4,764) Cash flows from investing activities Plant improvements(net) ($900) ($7,100) ($4,840) ($4,800) Cash flows from financing activities Dividends paid $0 Sales of common stock $8,400 $5,000 $4,000 $4,000 $7,000 $0 Purchase of common stock $0 $0 SO $0 Cash from long term debt issued SO $0 $4.000 $3,000 $4,000 Early retirement of long term debt $0 $0 Retirement of current debt ($867) ($867) ($867) Cash from current debt borrowing $0 $2,000 $1,000 $0 Cash from emergency loan $0 $0 SO $2,268 Net cash from financing activities $7,533 $4,133 $10,133 $401 Net change in cash position $6,610 ($809) $4,686 $4,523 $2, 185 ($9,163) Balance Sheet Survey Andrews Baldwin Chester Digby Erie Ferris $12,965 $5,011 $5,871 $0 Accounts Receivable $4,431 $2,814 $6, 167 $11,933 $7,479 $4,940 Inventory $2,083 $9.282 $8,065 $14,356 Total Current Assets $9,907 $28,936 $31,027 $16,738 Plant and equipment $21,500 $33,100 $31,500 $40,500 $30,600 Accumulated Depreciation $6,963) ($9,673) ($9,280) ($10,815) ($10,531) Total Fixed Assets $14,537 $23,427 $29,685 $26,869 $21,040 Total Assets $43,999 $33,334 $58,621 $57,896 $37,778 Accounts Payable $4,055 $2,439 $4,541 $7,570 $6,878 $3,979 Current Debt SO $2,000 $1,000 SO $2,268 Total Current Liabilities $4,055 $2,439 $6.541 $8,570 $6.878 $6,247 Long Term Debt $4,333 $9,333 $10,533 $15,333 $16, 106 $9,813 Total Liabilities $8,389 $11,772 $23,903 $16,060 Common Stock $15, 190 $8,023 $9,323 $13,323 $16,923 $4,323 Retained Earnings $20,420 $13,539 $17,142 $21,395 $17,989 $17,394 Total Equity $35,610 $21,562 $26,465 $34,718 $34,912 $21,718 Total Liabilities & Owners Equity $43,999 $33,334 $43,539 $58,621 $57,896 $37,778 Income Statement Survey Andrews Baldwin Digby Erie Ferris Sales $50,537 $41,080 $75,029 $87,110 $77,996 $60, 104 Variable Costs(Labor, Material, Carry) $34,600 $25,223 $52, 153 $60,482 $55,679 $40,904 Contribution Margin $15,937 $15,857 $22,876 $26,628 $22,317 Depreciation $1,200 $2,207 $1,833 $2,700 $2,493 $2,040 SGA(R&D,Promo, Sales,Admin) $9,220 $14,057 $12,755 $11,241 $12,329 $13,591 Other(Fees, Writeoffs, TOM,Bonuses) $250 $250 $350 $0 $5,268 $12,336 $6,945 $3,569 Interest(Short term,Long term) $1,055 $1,320 $1,800 $1,778 $1,442 Taxes $1,653 $2,299 $3,688 $1,808 Profit Sharing $61 $85 $67 $28 Net Profit $3,008 ($1,113) $4,184 $6,712 $3,291 $1,355 FOUNDATION @ FAST TRACK Page 3Financial Summary FastTrack F80308 Round: 3 Dec. 31, 2019 Cash Flow Statement Survey Andrews Baldwin Digby Erie Ferris CashFlows from operating activities Net Income(Loss) $3,008 $4,184 $6,712 $3,291 $1,355 Adjustment for non-cash items: Depreciation $1,200 $2,207 $1,833 $2,700 $2,493 $2,040 Extraordinary gains/losses/writeoffs ($170) $0 $0 SO Changes in current assets and liablilities Accounts payable ($679) $619 $2,076 $3,394 $1,402 Inventory ($3,852) ($458) ($4,206) ($1,885) ($8,803 ($8,923) Accounts Receivable $470 ($97) ($2,134) ($3,431) ($1,492) ($3 Net cash from operations $1, 158 $1,753 ($4,764) Cash flows from investing activities Plant improvements(net) ($900) ($7,100) ($4,840) ($4,800) Cash flows from financing activities Dividends paid $0 Sales of common stock $8,400 $5,000 $4,000 $4,000 $7,000 $0 Purchase of common stock $0 $0 SO $0 Cash from long term debt issued SO $0 $4.000 $3,000 $4,000 Early retirement of long term debt $0 $0 Retirement of current debt ($867) ($867) ($867) Cash from current debt borrowing $0 $2,000 $1,000 $0 Cash from emergency loan $0 $0 SO $2,268 Net cash from financing activities $7,533 $4,133 $10,133 $401 Net change in cash position $6,610 ($809) $4,686 $4,523 $2, 185 ($9,163) Balance Sheet Survey Andrews Baldwin Chester Digby Erie Ferris $12,965 $5,011 $5,871 $0 Accounts Receivable $4,431 $2,814 $6, 167 $11,933 $7,479 $4,940 Inventory $2,083 $9.282 $8,065 $14,356 Total Current Assets $9,907 $28,936 $31,027 $16,738 Plant and equipment $21,500 $33,100 $31,500 $40,500 $30,600 Accumulated Depreciation $6,963) ($9,673) ($9,280) ($10,815) ($10,531) Total Fixed Assets $14,537 $23,427 $29,685 $26,869 $21,040 Total Assets $43,999 $33,334 $58,621 $57,896 $37,778 Accounts Payable $4,055 $2,439 $4,541 $7,570 $6,878 $3,979 Current Debt SO $2,000 $1,000 SO $2,268 Total Current Liabilities $4,055 $2,439 $6.541 $8,570 $6.878 $6,247 Long Term Debt $4,333 $9,333 $10,533 $15,333 $16, 106 $9,813 Total Liabilities $8,389 $11,772 $23,903 $16,060 Common Stock $15, 190 $8,023 $9,323 $13,323 $16,923 $4,323 Retained Earnings $20,420 $13,539 $17,142 $21,395 $17,989 $17,394 Total Equity $35,610 $21,562 $26,465 $34,718 $34,912 $21,718 Total Liabilities & Owners Equity $43,999 $33,334 $43,539 $58,621 $57,896 $37,778 Income Statement Survey Andrews Baldwin Digby Erie Ferris Sales $50,537 $41,080 $75,029 $87,110 $77,996 $60, 104 Variable Costs(Labor, Material, Carry) $34,600 $25,223 $52, 153 $60,482 $55,679 $40,904 Contribution Margin $15,937 $15,857 $22,876 $26,628 $22,317 Depreciation $1,200 $2,207 $1,833 $2,700 $2,493 $2,040 SGA(R&D,Promo, Sales,Admin) $9,220 $14,057 $12,755 $11,241 $12,329 $13,591 Other(Fees, Writeoffs, TOM,Bonuses) $250 $250 $350 $0 $5,268 $12,336 $6,945 $3,569 Interest(Short term,Long term) $1,055 $1,320 $1,800 $1,778 $1,442 Taxes $1,653 $2,299 $3,688 $1,808 Profit Sharing $61 $85 $67 $28 Net Profit $3,008 ($1,113) $4,184 $6,712 $3,291 $1,355 FOUNDATION @ FAST TRACK Page 3Production Analysis FastTrack F80308 Round: 3 Dec. 31, 2019 Production Vs. Capacity F80308 Andrews Baldwin Chester Digby Erie Ferris 200 400 600 800 1.000 1.200 1.400 1.600 1.800 2,000 2.200 2,400 O Capacity O Production 2nd Shift Auto Unit & mation Capacity Plant Primary Units Inven Revision Age Pimn Size Material Labor Contr. Over- Next Next Name Segment Sold tory Date Dec.31 MTBE Coord Coord Price Cost Cost Marg. time Round Round Utiliz. Low 968 270 5/12/2019 2.5 18000 6.5 13.5 $35.00 $11.44 $10.69 34% 43% 3.5 700 140% Able 8.5 11.5 $45.00 $16.36 $13.75 28% 27% 400 125% Aco High 370 195 5/11/2019 1.1 21000 7/2/2020 0.0 $0.00 $0.00 $0.00 0% 0% 10 350 Arrow 41% 0%% 1.U 1.050 98% Baker Low 1.004 52 6/3/2019 1.7 19000 $35.00 $11.54 $8.66 23000 11.9 $16.89 $15.30 500 8.8 28% 1.0 0.1 $45.00 20% Banana High 49 0 11/20/2019 32 10/1/2019 0.2 22000 11.9 $43.00 $15.86 $15.30 24% 100% 500 47 % Boost High 3.9 2000 1.000 182% Cake Low 1.565 78 3/17/2018 6.2 13.8 $33.50 $11.43 $10.47 43% 83% 1.0 LO 550 108%% Clique High 509 238 7/2/2019 0.9 22000 9.5 10.5 $45.00 $18.68 $12.79 26% 00 $0.00 50.00 0% 10 0.0 400 Cairo 0 4/29/2020 Daza Low 1.513 128 2/26/2018 3.2 2000 13.5 $35.00 $12.14 $10.91 32% 100% 5.0 950 193% 167 1/21/2020 1.3 23000 B.8 11.2 $44.00 $17.57 $11.34 28% 2.0 700 76% DOX High 480 16 500 58% Dodo High 290 0 11/12/2018 1.1 23000 95 10.5 $45.00 $18.98 $11.97 30% 3/4/2017 4.5 2000 6.5 13.6 $33.90 $11.94 $10.41 30% 38% 4.5 1,100 1649% Low 220 417 29% 10 600 57% Eagle High 391 99 2/1/2020 1.4 2000 8.8 11.2 $44.90 $16.67 $12.47 10 500 98% Energy High 434 54 11/12/2018 23000 9.5 10.5 $43.90 $18.98 $12.47 26% 0% 41 11/30/2019 18000 7.5 $35.00 $13.35 $9.51 36% 28% 4.5 900 Fast Low 1.099 2.3 26% 44% 450 142% High 240 277 12/24/2020 1.6 20000 8.0 12.0 $46.00 $15.06 $14.09 9.5 10.5 $46.00 $18.38 $14.50 25% 60% 10 450 102% Fire High 230 5/8/2019 0.6 21000 FOUNDATION @ FAST TRACK Page 4Production Analysis FastTrack F80308 Round: 3 Dec. 31, 2019 Production Vs. Capacity F80308 Andrews Baldwin Chester Digby Erie Ferris 200 400 600 800 1.000 1.200 1.400 1.600 1.800 2,000 2.200 2,400 O Capacity O Production 2nd Shift Auto Unit & mation Capacity Plant Primary Units Inven Revision Age Pimn Size Material Labor Contr. Over- Next Next Name Segment Sold tory Date Dec.31 MTBE Coord Coord Price Cost Cost Marg. time Round Round Utiliz. Low 968 270 5/12/2019 2.5 18000 6.5 13.5 $35.00 $11.44 $10.69 34% 43% 3.5 700 140% Able 8.5 11.5 $45.00 $16.36 $13.75 28% 27% 400 125% Aco High 370 195 5/11/2019 1.1 21000 7/2/2020 0.0 $0.00 $0.00 $0.00 0% 0% 10 350 Arrow 41% 0%% 1.U 1.050 98% Baker Low 1.004 52 6/3/2019 1.7 19000 $35.00 $11.54 $8.66 23000 11.9 $16.89 $15.30 500 8.8 28% 1.0 0.1 $45.00 20% Banana High 49 0 11/20/2019 32 10/1/2019 0.2 22000 11.9 $43.00 $15.86 $15.30 24% 100% 500 47 % Boost High 3.9 2000 1.000 182% Cake Low 1.565 78 3/17/2018 6.2 13.8 $33.50 $11.43 $10.47 43% 83% 1.0 LO 550 108%% Clique High 509 238 7/2/2019 0.9 22000 9.5 10.5 $45.00 $18.68 $12.79 26% 00 $0.00 50.00 0% 10 0.0 400 Cairo 0 4/29/2020 Daza Low 1.513 128 2/26/2018 3.2 2000 13.5 $35.00 $12.14 $10.91 32% 100% 5.0 950 193% 167 1/21/2020 1.3 23000 B.8 11.2 $44.00 $17.57 $11.34 28% 2.0 700 76% DOX High 480 16 500 58% Dodo High 290 0 11/12/2018 1.1 23000 95 10.5 $45.00 $18.98 $11.97 30% 3/4/2017 4.5 2000 6.5 13.6 $33.90 $11.94 $10.41 30% 38% 4.5 1,100 1649% Low 220 417 29% 10 600 57% Eagle High 391 99 2/1/2020 1.4 2000 8.8 11.2 $44.90 $16.67 $12.47 10 500 98% Energy High 434 54 11/12/2018 23000 9.5 10.5 $43.90 $18.98 $12.47 26% 0% 41 11/30/2019 18000 7.5 $35.00 $13.35 $9.51 36% 28% 4.5 900 Fast Low 1.099 2.3 26% 44% 450 142% High 240 277 12/24/2020 1.6 20000 8.0 12.0 $46.00 $15.06 $14.09 9.5 10.5 $46.00 $18.38 $14.50 25% 60% 10 450 102% Fire High 230 5/8/2019 0.6 21000 FOUNDATION @ FAST TRACK Page 4Low Tech Segment Analysis FastTrack F80308 Round: 3 Dec. 31, 2019 Low Tech Statistics Accessibility F80308 Low Tech Total Industry Unit Demand 6,708 Actual Industry Unit Sales 16,708 Andrew's Segment % of Total Industry 164.3% Baldwin Next Year's Segment Growth Rate (10.0% Chester Low Tech Customer Buying Criteria Digby Expectations Importance Erie 1. Price $15.00 - 35.00 41% 2. Age Ideal Age = 3.0 29% Ferris 3. Reliability MTBF 14000-20000 21% 4. Ideal Position Pfmn 6.3 Size 13.7 9% 0% 20% 40% 60% 80% 100% Perceptual Map for Low Tech Actual vs Potential Market Share Perceptual map (at end of this year) 20 2019 F80308 Low Tech 18 22% 20% 16 18% 16% 14 14% 12 12% Size 10% 10 8% 6% 4% 2% 0% N Andrews Baldwin Chester Digby Erie Ferris 2 4 6 8 10 12 14 16 18 20 O Actual Potential Performance Top Products in Low Tech Segment Units Cust. Cust. Dec. Market Sold to Revision Stock Pfmn Size List Age Promo Aware Sales Access- Cust Name Share Seg Date Out Coord Coord Price MTBF Dec.31 Budget ness Budget ibility Survey Cake 22% 1,449 3/17/2018 6.2 13.8 $33.50 20000 3.95 $1,500 100% $3,000 66% 33 Daze 21% 1,380 2/26/2018 6.6 13.5 $35.00 20000 3.15 $1,500 97% $2,500 73% 37 Eat 17% 1,123 3/4/2017 6.5 13.6 $33.90 20000 4.46 $1,000 88% $2,000 67% 25 Fast 15% 996 11/30/2019 7.5 12.6 $35.00 18000 2.28 $2,000 95% $2,000 61% 19 Able 13% 875 5/12/2019 6.5 13.5 $35.00 18000 2.51 $1,500 100% $1,500 53% 24 Baker 13% 863 6/3/2019 6.5 13.7 $35.00 19000 1.69 $1,500 91% $1,800 64% Boost 0% 15 10/1/2019 8.1 11.9 $43.00 22000 0.24 $2,000 70% $2,000 64% 0% 8.8 11.2 $44.00 23000 1.35 $1,800 89% $0 Dex 1/21/2020 73% FOUNDATION @ FAST TRACK Page 5Low Tech Segment Analysis FastTrack F80308 Round: 3 Dec. 31, 2019 Low Tech Statistics Accessibility F80308 Low Tech Total Industry Unit Demand 6,708 Actual Industry Unit Sales 16,708 Andrew's Segment % of Total Industry 164.3% Baldwin Next Year's Segment Growth Rate (10.0% Chester Low Tech Customer Buying Criteria Digby Expectations Importance Erie 1. Price $15.00 - 35.00 41% 2. Age Ideal Age = 3.0 29% Ferris 3. Reliability MTBF 14000-20000 21% 4. Ideal Position Pfmn 6.3 Size 13.7 9% 0% 20% 40% 60% 80% 100% Perceptual Map for Low Tech Actual vs Potential Market Share Perceptual map (at end of this year) 20 2019 F80308 Low Tech 18 22% 20% 16 18% 16% 14 14% 12 12% Size 10% 10 8% 6% 4% 2% 0% N Andrews Baldwin Chester Digby Erie Ferris 2 4 6 8 10 12 14 16 18 20 O Actual Potential Performance Top Products in Low Tech Segment Units Cust. Cust. Dec. Market Sold to Revision Stock Pfmn Size List Age Promo Aware Sales Access- Cust Name Share Seg Date Out Coord Coord Price MTBF Dec.31 Budget ness Budget ibility Survey Cake 22% 1,449 3/17/2018 6.2 13.8 $33.50 20000 3.95 $1,500 100% $3,000 66% 33 Daze 21% 1,380 2/26/2018 6.6 13.5 $35.00 20000 3.15 $1,500 97% $2,500 73% 37 Eat 17% 1,123 3/4/2017 6.5 13.6 $33.90 20000 4.46 $1,000 88% $2,000 67% 25 Fast 15% 996 11/30/2019 7.5 12.6 $35.00 18000 2.28 $2,000 95% $2,000 61% 19 Able 13% 875 5/12/2019 6.5 13.5 $35.00 18000 2.51 $1,500 100% $1,500 53% 24 Baker 13% 863 6/3/2019 6.5 13.7 $35.00 19000 1.69 $1,500 91% $1,800 64% Boost 0% 15 10/1/2019 8.1 11.9 $43.00 22000 0.24 $2,000 70% $2,000 64% 0% 8.8 11.2 $44.00 23000 1.35 $1,800 89% $0 Dex 1/21/2020 73% FOUNDATION @ FAST TRACK Page 5High Tech Segment Analysis FastTrack F80308 Round: 3 Dec. 31, 2019 High Tech Statistics Accessibility F80308 High Tech Total Industry Unit Demand 3,732 Actual Industry Unit Sales 13,732 Andrews Segment % of Total Industry |35.8% Baldwin Next Year's Segment Growth Rate 120.0% Chester High Tech Customer Buying Criteria Digby Expectations Importance Erie 1. Ideal Position Pfmn 9.5 Size 10.5 33% 2. Age Ideal Age = 0.0 29% Ferris 3. Price $25.00 - 45.00 25% 4. Reliability MTBF 17000-23000 13% 0% 20% 40% 60% 80% 100% Perceptual Map for High Tech Actual vs Potential Market Share Perceptual map (at end of this year) 2019 F80308 High Tech 20 18 25%% 16 20% 14 12 15% Size 10 10% 5% 0% N Andrews Baldwin Chester Digby Erie Ferris 2 6 8 10 12 14 16 18 20 O Actual Potential Performance Top Products in High Tech Segment Units Cust. Cust. Dec. Market Sold to Revision Stock Pfmn Size List Age Promo Aware- Sales Access- Cust Name Share Seg Date Out Coord Coord Price MTBF Dec.31 Budget ness Budget ibility Survey Clique 14% 509 7/2/2019 9.5 10.5 $45.00 22000 0.95 $2,400 94% $3,000 80% 47 Dex 13% 473 1/21/2020 8.8 11.2 $44.00 23000 1.35 $1,800 89% 80% 36 Energy 12% 434 11/12/2018 9.5 10.5 $43.90 23000 1.12 $2,000 62% $2,000 85% 41 Eagle 10% 391 2/1/2020 8.8 11.2 $44.90 20000 1.41 $2,000 86% $1,000 85% 29 Acor 10% 370 5/1 1/2019 8.5 11.5 $45.00 21000 1.12 $2,000 92% $1,500 74% 29 Dodo 8% 290 11/12/2018 YES 9.5 10.5 $45.00 23000 1.12 $1,500 53% $1,500 80% 37 First 6% 240 12/24/2020 8.0 12.0 $46.00 20000 1.64 $2,000 92% $1,500 80% 15 Fire 6% 230 5/8/2019 9.5 10.5 $46.00 21000 0.65 $1,500 61% $1,300 80% 33 Baker 4% 141 6/3/2019 6.5 13.7 $35.00 19000 1.69 $1,500 91% $1,800 65% 13 Daze 4% 133 2/26/2018 6.6 13.5 $35.00 20000 3.15 $1,500 97% $2,500 80% 10 Cake 3% 106 3/17/2018 6.2 13.8 $33.50 20000 3.95 $1,500 100% $3,000 80% 8 Fast 3% 103 11/30/2019 7.5 12.6 $35.00 18000 2.28 $2,000 95% $2,000 80% FOUNDATION @ FAST TRACK Page 6High Tech Segment Analysis FastTrack F80308 Round: 3 Dec. 31, 2019 High Tech Statistics Accessibility F80308 High Tech Total Industry Unit Demand 3,732 Actual Industry Unit Sales 13,732 Andrews Segment % of Total Industry |35.8% Baldwin Next Year's Segment Growth Rate 120.0% Chester High Tech Customer Buying Criteria Digby Expectations Importance Erie 1. Ideal Position Pfmn 9.5 Size 10.5 33% 2. Age Ideal Age = 0.0 29% Ferris 3. Price $25.00 - 45.00 25% 4. Reliability MTBF 17000-23000 13% 0% 20% 40% 60% 80% 100% Perceptual Map for High Tech Actual vs Potential Market Share Perceptual map (at end of this year) 2019 F80308 High Tech 20 18 25%% 16 20% 14 12 15% Size 10 10% 5% 0% N Andrews Baldwin Chester Digby Erie Ferris 2 6 8 10 12 14 16 18 20 O Actual Potential Performance Top Products in High Tech Segment Units Cust. Cust. Dec. Market Sold to Revision Stock Pfmn Size List Age Promo Aware- Sales Access- Cust Name Share Seg Date Out Coord Coord Price MTBF Dec.31 Budget ness Budget ibility Survey Clique 14% 509 7/2/2019 9.5 10.5 $45.00 22000 0.95 $2,400 94% $3,000 80% 47 Dex 13% 473 1/21/2020 8.8 11.2 $44.00 23000 1.35 $1,800 89% 80% 36 Energy 12% 434 11/12/2018 9.5 10.5 $43.90 23000 1.12 $2,000 62% $2,000 85% 41 Eagle 10% 391 2/1/2020 8.8 11.2 $44.90 20000 1.41 $2,000 86% $1,000 85% 29 Acor 10% 370 5/1 1/2019 8.5 11.5 $45.00 21000 1.12 $2,000 92% $1,500 74% 29 Dodo 8% 290 11/12/2018 YES 9.5 10.5 $45.00 23000 1.12 $1,500 53% $1,500 80% 37 First 6% 240 12/24/2020 8.0 12.0 $46.00 20000 1.64 $2,000 92% $1,500 80% 15 Fire 6% 230 5/8/2019 9.5 10.5 $46.00 21000 0.65 $1,500 61% $1,300 80% 33 Baker 4% 141 6/3/2019 6.5 13.7 $35.00 19000 1.69 $1,500 91% $1,800 65% 13 Daze 4% 133 2/26/2018 6.6 13.5 $35.00 20000 3.15 $1,500 97% $2,500 80% 10 Cake 3% 106 3/17/2018 6.2 13.8 $33.50 20000 3.95 $1,500 100% $3,000 80% 8 Fast 3% 103 11/30/2019 7.5 12.6 $35.00 18000 2.28 $2,000 95% $2,000 80% FOUNDATION @ FAST TRACK Page 6Market Share FastTrack F80308 Round: 3 Dec. 31, 2019 Units Sold vs Demand Chart F80308 Market Share F80308 6,000 20% 5,000 4,000 10% 3,000 2,000 0% 1,000 Baldwin Digby Erie Low Andrews Ferris High Chester Industry Unit Sales ) Total Unit Demand Low O High Actual Market Share in Units Potential Market Share in Units Low High Total Industry Unit Sales 6,708 High Total 3,732 10,441 Units Demanded Low 6,708 10,441 35.8% 100.0% % of Market 3,732 of Market 64.3% 64.3% 35.8% 100.0% Able 13.0% 2.5% 9.3% Able 13.0% 2.4% 9.2% 9.9% 3.5% Acor 9.6% 3.4% Total 13.0% 12.4% 12.8% Total 13.0% 12.1% 12.7% Baker 12.9% 3.8% 9.6% Baker 12.8% 3.7% 9.6% Banana 1.3% 0.5% Banana 1.4% 0.5% Boost 0.2% 1.9% 0.8% Boost 0.2% 1.9% 0.8% Total 13.1% 7.0% 10.9% Total 13.1% 6.9% 10.9% Cake 21.6% 2.8% 14.9% Cake 21.6% 2.8% 14.9% Clique 13.7% 4.9% Clique 13.3% 4.7% Total 21.6% 16.5% 19.8% Total 21.6% 16.0% 19.6% Daze 20.6% 3.6% 14.5% Daze 20.5% 3.5% 14.4% Dax 12.7% 4.6% Dex 12.3% 4.5% Dodo 7.8% 2.8% Dodo 3.6% Total 24.0% 21.9% Total 20.6% 10.2% 20.7% 26.0% 22.6% Eat 16.7% 2.6% 11.7% Eat 16.7% 2.5% 11.7% Eagle 10.5% 3.8% Eagle 10.2% 3.6% Energy 11.6% 4.2% Energy 11.3% 4.0% Total 16.8% 19.6% Total 16.7% 24.0% 19.3% Fast 14.8% 2.8% 10.5% Fast 15.0% 2.7% 10.6% 6.4% 2.3% First 6.3% 2.2% Fire Fire 2.1% Total 14.8% 6.2% 6.0% 15.4% Total 14.9% 15.0% 15.0% FOUNDATION . FAST TRACK Page 7Market Share FastTrack F80308 Round: 3 Dec. 31, 2019 Units Sold vs Demand Chart F80308 Market Share F80308 6,000 20% 5,000 4,000 10% 3,000 2,000 0% 1,000 Baldwin Digby Erie Low Andrews Ferris High Chester Industry Unit Sales ) Total Unit Demand Low O High Actual Market Share in Units Potential Market Share in Units Low High Total Industry Unit Sales 6,708 High Total 3,732 10,441 Units Demanded Low 6,708 10,441 35.8% 100.0% % of Market 3,732 of Market 64.3% 64.3% 35.8% 100.0% Able 13.0% 2.5% 9.3% Able 13.0% 2.4% 9.2% 9.9% 3.5% Acor 9.6% 3.4% Total 13.0% 12.4% 12.8% Total 13.0% 12.1% 12.7% Baker 12.9% 3.8% 9.6% Baker 12.8% 3.7% 9.6% Banana 1.3% 0.5% Banana 1.4% 0.5% Boost 0.2% 1.9% 0.8% Boost 0.2% 1.9% 0.8% Total 13.1% 7.0% 10.9% Total 13.1% 6.9% 10.9% Cake 21.6% 2.8% 14.9% Cake 21.6% 2.8% 14.9% Clique 13.7% 4.9% Clique 13.3% 4.7% Total 21.6% 16.5% 19.8% Total 21.6% 16.0% 19.6% Daze 20.6% 3.6% 14.5% Daze 20.5% 3.5% 14.4% Dax 12.7% 4.6% Dex 12.3% 4.5% Dodo 7.8% 2.8% Dodo 3.6% Total 24.0% 21.9% Total 20.6% 10.2% 20.7% 26.0% 22.6% Eat 16.7% 2.6% 11.7% Eat 16.7% 2.5% 11.7% Eagle 10.5% 3.8% Eagle 10.2% 3.6% Energy 11.6% 4.2% Energy 11.3% 4.0% Total 16.8% 19.6% Total 16.7% 24.0% 19.3% Fast 14.8% 2.8% 10.5% Fast 15.0% 2.7% 10.6% 6.4% 2.3% First 6.3% 2.2% Fire Fire 2.1% Total 14.8% 6.2% 6.0% 15.4% Total 14.9% 15.0% 15.0% FOUNDATION . FAST TRACK Page 7