please help me by wring down the Excel operating steps 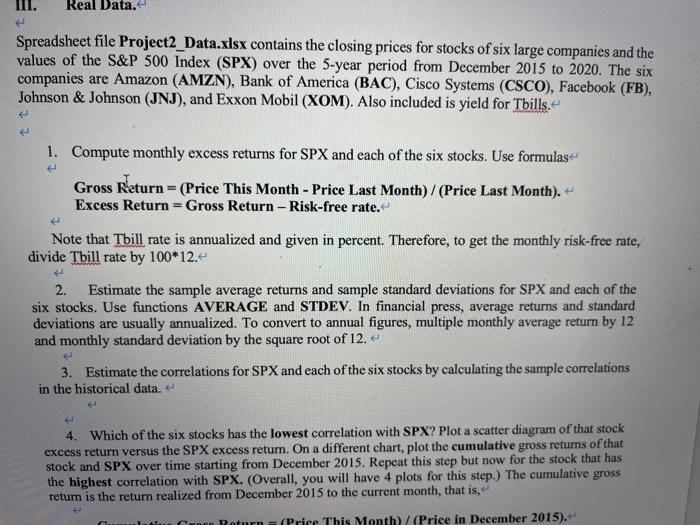
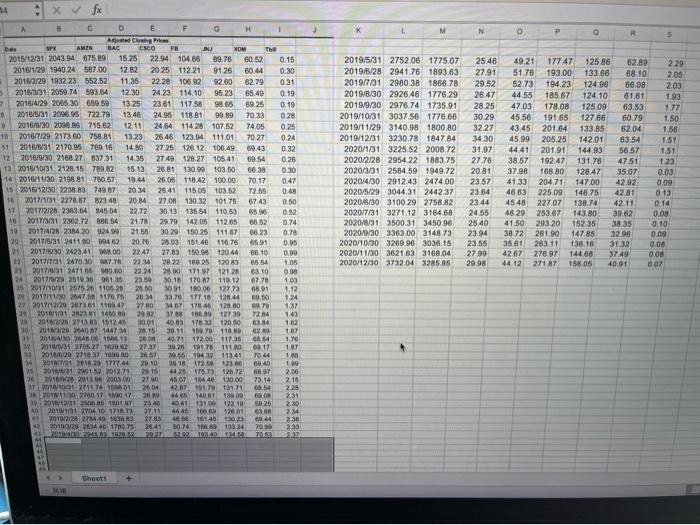
Real Data. Spreadsheet file Project2_Data.xlsx contains the closing prices for stocks of six large companies and the values of the S&P 500 Index (SPX) over the 5-year period from December 2015 to 2020. The six companies are Amazon (AMZN), Bank of America (BAC), Cisco Systems (CSCO), Facebook (FB), Johnson & Johnson (JNJ), and Exxon Mobil (XOM). Also included is yield for Tbills. 1. Compute monthly excess returns for SPX and each of the six stocks. Use formulas Gross Return = (Price This Month - Price Last Month)/(Price Last Month). Excess Return = Gross Return - Risk-free rate. Note that Thill rate is annualized and given in percent. Therefore, to get the monthly risk-free rate, divide Thill rate by 100*12. 2. Estimate the sample average returns and sample standard deviations for SPX and each of the six stocks. Use functions AVERAGE and STDEV. In financial press, average returns and standard deviations are usually annualized. To convert to annual figures, multiple monthly average return by 12 and monthly standard deviation by the square root of 12. 3. Estimate the correlations for SPX and each of the six stocks by calculating the sample correlations in the historical data. 4. Which of the six stocks has the lowest correlation with SPX? Plot a scatter diagram of that stock excess return versus the SPX excess retum. On a different chart, plot the cumulative gross retums of that stock and SPX over time starting from December 2015. Repeat this step but now for the stock that has the highest correlation with SPX. (Overall, you will have 4 plots for this step.) The cumulative gross retum is the return realized from December 2015 to the current month, that is, tin Poturn (Price This Month)/(Price in December 2015). 14 : x x M N 0 P o R CSCO 0.19 B D E F G Ang Des AMZN BAC FR NU XOM The 2015/12/31 2043.94 675.89 15.25 22.94 104.66 89.76 6052 0.15 2016/1/29 1940 24 587.00 12.82 20.25 112.21 91.26 6044 0.30 2012/29 1932.23 652.52 11.35 22 28 106.92 82.60 62.79 0 31 2016/3/31 2059.74 593.64 12.30 24 23 114,10 95.23 65.49 0.19 7 2016/4/29 2006.30 059.59 13.25 23.61 117.50 98.66 89 25 2016/521 2006.95 722.79 13.46 24.95 118.81 99.89 70.33 0.28 2016/6/30 2098.86 715.62 12.11 2464 114 28 107 52 74.05 0.25 10 2016/7/29 2173.50 758.89 13.23 26.48 123 94 11101 70 27 0.24 11 2016/8/31 2170 95 709.10 14.80 27 25 126 12 106.49 69.43 0.32 12 2016/9/30 2168.27 837.31 1435 2749 128.27 105 41 69.54 0.26 12 2016/11 2126.15 780.82 15.13 26.01 130.99 103.50 66.38 0.30 14 2016/11/30. 2198 81 780.57 19.44 26.08 118.42 100.00 70.17 0.47 15 2015/12/30 2238.63 749 87 2034 25.41 115 05 103.52 72.55 0.48 16 2017/1831 2278.87 623.48 20 B4 2708 130 32 101.75 6743 0.50 201712/25 2363.64 145 04 22.72 30.13 125,54 110.53 650 052 20170331 2302.72 0.14 21.70 28.79 142.05 11265 05.52 0.74 19 2017/4128 2384 20 924 99 21.55 30.29 150.25 111 67 5623 0.78 20 201710131 2411.00 10482 20.70 28.03 151.46 116.76 6591 0.95 20 2017/11/30 242341968.00 2247 2763 150 90 120 44 06.10 0.00 2017 at 2476 30 7.TR 22.34 28 22 189 25 120 83 6554 1.05 23 2017/0312471650.00 22.24 2800 111 121.28 63.10 0.00 24 201710292519 30 00135 23.50 30.10170-17 110-12 0778 100 25 2017/01 26752 510520 26.00 2001 160061277a 0891 1.12 29 201711176 204711170,75 26 M 33.70 177.18 120.44 000 1.24 27 201711729 267361 TA? 37.60 1467 17640 120 00 60 TO 137 2011 2631 1400.00 2012 378 16.80 12739 72.84 143 2012/28 9713.63 151245 30.01 176,2120,50 6384 1.02 10 2013 21407 1447 2015 2016 2015 30.11 0 118. 02:00 107 40.71 172.0011735 40,54 110 12 701 270527100062 920 191 70 1110 02.17 1.07 2010120,271037 10000 30.5511432 11341 70.44 100 2011 2010 201744 30.18 172. 1730 0.40 1.9 35 201 20272 2015 1200 12072 66.97 2.00 2 2750 45 OT194 40 73.14 20111001 271174159001 216 2004 420 191.70 3171 ca. 2.28 201110276037 017 20 M 44 S 14001 139.00 60 2.31 30201105017 7340 404119 122.19 50 25 2.30 2013 270410171073 4446 16612001 63 734 41 201001282784403 2783 1860 1014513023 1944 2.30 2019029 2034 AD 1709 75 50.74186.69 13324 705 2010 229.27 1909 1010 2009 27 45 2019/5/31 2752 06 1775.07 2019/6/28 294176 1893.63 2019/7/31 2980.38 1866.78 2019/8/30 2926.46 1776.29 2019/9/30 2976.74 1735.91 2019/10/31 3037 56 1776.66 2019/11/29 3140.08 1800 80 2019/12/31 3230.78 1847 84 2020/1/31 3225.52 2008.72 2020/2/28 2954 22 188375 2020/3/31 2584.59 1949.72 2020/4/30 291243 2474 00 2020/5/29 3044 31 2442.37 2020/6/30 3100 29 2758 82 2020/7/31 3271.12 3164 68 2020/8/31 3500.31 3450.96 2020/230 3363.00 3148 73 2020/0/30 3269.96 3030,15 2020/11/30 3621 63 316804 2020/12/30 3732.04 3285.85 25.46 49.21 177.47 125.88 82.89 2.29 27.91 51.76 193.00 133.66 68.10 205 2952 52.73 194.23 124.96 66.08 2.03 26.47 44.55 185.67 124.10 61.61 1.93 28.25 47.03 178.08 125.09 63.53 1.77 30.29 45 56 19165 127.66 60.79 1.50 32.27 43.45 201.64 133.85 62.04 1.56 34.30 45.99 205.25 14201 63.54 151 31.97 44.41 201.91 144.93 56.57 1.51 27.70 38.57 19247 131.78 47 51 1.23 20.81 37 98 166 80 12847 35.07 0.03 23.57 41.33 204.71 147.00 42.92 0.09 23.64 46.63 225.09 146.75 4281 0.13 23.44 45 48 227.07 138.74 4211 0.14 24.55 4620 25367 143.80 39.62 0.00 2540 41.50 293.20 15235 38 35 0.10 23.94 38 72 261.90 147 85 32.00 0.00 23.55 35 61 203 11 138.10 31.32 0.08 2799 42.67 276.97 144.80 3749 0.00 29.08 44:12 271.87 158.05 40 01 007 20 731 210 2002 129200300 23 Sheets Real Data. Spreadsheet file Project2_Data.xlsx contains the closing prices for stocks of six large companies and the values of the S&P 500 Index (SPX) over the 5-year period from December 2015 to 2020. The six companies are Amazon (AMZN), Bank of America (BAC), Cisco Systems (CSCO), Facebook (FB), Johnson & Johnson (JNJ), and Exxon Mobil (XOM). Also included is yield for Tbills. 1. Compute monthly excess returns for SPX and each of the six stocks. Use formulas Gross Return = (Price This Month - Price Last Month)/(Price Last Month). Excess Return = Gross Return - Risk-free rate. Note that Thill rate is annualized and given in percent. Therefore, to get the monthly risk-free rate, divide Thill rate by 100*12. 2. Estimate the sample average returns and sample standard deviations for SPX and each of the six stocks. Use functions AVERAGE and STDEV. In financial press, average returns and standard deviations are usually annualized. To convert to annual figures, multiple monthly average return by 12 and monthly standard deviation by the square root of 12. 3. Estimate the correlations for SPX and each of the six stocks by calculating the sample correlations in the historical data. 4. Which of the six stocks has the lowest correlation with SPX? Plot a scatter diagram of that stock excess return versus the SPX excess retum. On a different chart, plot the cumulative gross retums of that stock and SPX over time starting from December 2015. Repeat this step but now for the stock that has the highest correlation with SPX. (Overall, you will have 4 plots for this step.) The cumulative gross retum is the return realized from December 2015 to the current month, that is, tin Poturn (Price This Month)/(Price in December 2015). 14 : x x M N 0 P o R CSCO 0.19 B D E F G Ang Des AMZN BAC FR NU XOM The 2015/12/31 2043.94 675.89 15.25 22.94 104.66 89.76 6052 0.15 2016/1/29 1940 24 587.00 12.82 20.25 112.21 91.26 6044 0.30 2012/29 1932.23 652.52 11.35 22 28 106.92 82.60 62.79 0 31 2016/3/31 2059.74 593.64 12.30 24 23 114,10 95.23 65.49 0.19 7 2016/4/29 2006.30 059.59 13.25 23.61 117.50 98.66 89 25 2016/521 2006.95 722.79 13.46 24.95 118.81 99.89 70.33 0.28 2016/6/30 2098.86 715.62 12.11 2464 114 28 107 52 74.05 0.25 10 2016/7/29 2173.50 758.89 13.23 26.48 123 94 11101 70 27 0.24 11 2016/8/31 2170 95 709.10 14.80 27 25 126 12 106.49 69.43 0.32 12 2016/9/30 2168.27 837.31 1435 2749 128.27 105 41 69.54 0.26 12 2016/11 2126.15 780.82 15.13 26.01 130.99 103.50 66.38 0.30 14 2016/11/30. 2198 81 780.57 19.44 26.08 118.42 100.00 70.17 0.47 15 2015/12/30 2238.63 749 87 2034 25.41 115 05 103.52 72.55 0.48 16 2017/1831 2278.87 623.48 20 B4 2708 130 32 101.75 6743 0.50 201712/25 2363.64 145 04 22.72 30.13 125,54 110.53 650 052 20170331 2302.72 0.14 21.70 28.79 142.05 11265 05.52 0.74 19 2017/4128 2384 20 924 99 21.55 30.29 150.25 111 67 5623 0.78 20 201710131 2411.00 10482 20.70 28.03 151.46 116.76 6591 0.95 20 2017/11/30 242341968.00 2247 2763 150 90 120 44 06.10 0.00 2017 at 2476 30 7.TR 22.34 28 22 189 25 120 83 6554 1.05 23 2017/0312471650.00 22.24 2800 111 121.28 63.10 0.00 24 201710292519 30 00135 23.50 30.10170-17 110-12 0778 100 25 2017/01 26752 510520 26.00 2001 160061277a 0891 1.12 29 201711176 204711170,75 26 M 33.70 177.18 120.44 000 1.24 27 201711729 267361 TA? 37.60 1467 17640 120 00 60 TO 137 2011 2631 1400.00 2012 378 16.80 12739 72.84 143 2012/28 9713.63 151245 30.01 176,2120,50 6384 1.02 10 2013 21407 1447 2015 2016 2015 30.11 0 118. 02:00 107 40.71 172.0011735 40,54 110 12 701 270527100062 920 191 70 1110 02.17 1.07 2010120,271037 10000 30.5511432 11341 70.44 100 2011 2010 201744 30.18 172. 1730 0.40 1.9 35 201 20272 2015 1200 12072 66.97 2.00 2 2750 45 OT194 40 73.14 20111001 271174159001 216 2004 420 191.70 3171 ca. 2.28 201110276037 017 20 M 44 S 14001 139.00 60 2.31 30201105017 7340 404119 122.19 50 25 2.30 2013 270410171073 4446 16612001 63 734 41 201001282784403 2783 1860 1014513023 1944 2.30 2019029 2034 AD 1709 75 50.74186.69 13324 705 2010 229.27 1909 1010 2009 27 45 2019/5/31 2752 06 1775.07 2019/6/28 294176 1893.63 2019/7/31 2980.38 1866.78 2019/8/30 2926.46 1776.29 2019/9/30 2976.74 1735.91 2019/10/31 3037 56 1776.66 2019/11/29 3140.08 1800 80 2019/12/31 3230.78 1847 84 2020/1/31 3225.52 2008.72 2020/2/28 2954 22 188375 2020/3/31 2584.59 1949.72 2020/4/30 291243 2474 00 2020/5/29 3044 31 2442.37 2020/6/30 3100 29 2758 82 2020/7/31 3271.12 3164 68 2020/8/31 3500.31 3450.96 2020/230 3363.00 3148 73 2020/0/30 3269.96 3030,15 2020/11/30 3621 63 316804 2020/12/30 3732.04 3285.85 25.46 49.21 177.47 125.88 82.89 2.29 27.91 51.76 193.00 133.66 68.10 205 2952 52.73 194.23 124.96 66.08 2.03 26.47 44.55 185.67 124.10 61.61 1.93 28.25 47.03 178.08 125.09 63.53 1.77 30.29 45 56 19165 127.66 60.79 1.50 32.27 43.45 201.64 133.85 62.04 1.56 34.30 45.99 205.25 14201 63.54 151 31.97 44.41 201.91 144.93 56.57 1.51 27.70 38.57 19247 131.78 47 51 1.23 20.81 37 98 166 80 12847 35.07 0.03 23.57 41.33 204.71 147.00 42.92 0.09 23.64 46.63 225.09 146.75 4281 0.13 23.44 45 48 227.07 138.74 4211 0.14 24.55 4620 25367 143.80 39.62 0.00 2540 41.50 293.20 15235 38 35 0.10 23.94 38 72 261.90 147 85 32.00 0.00 23.55 35 61 203 11 138.10 31.32 0.08 2799 42.67 276.97 144.80 3749 0.00 29.08 44:12 271.87 158.05 40 01 007 20 731 210 2002 129200300 23 Sheets