please help me code
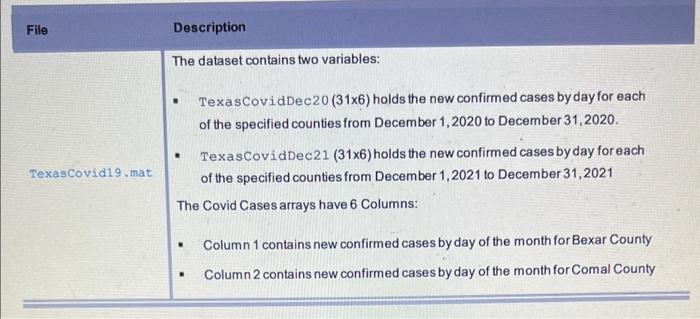
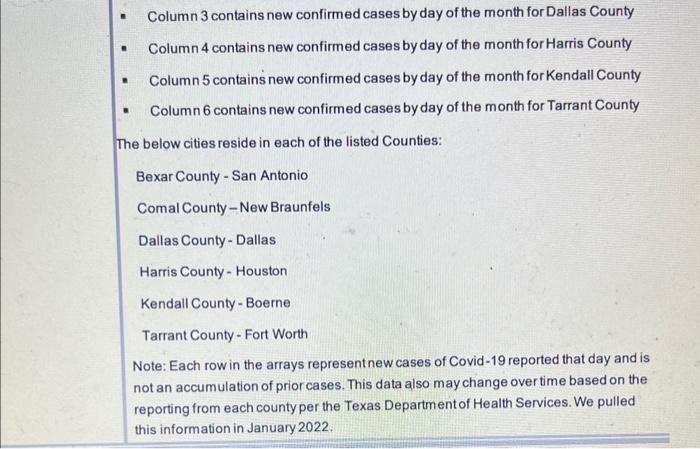
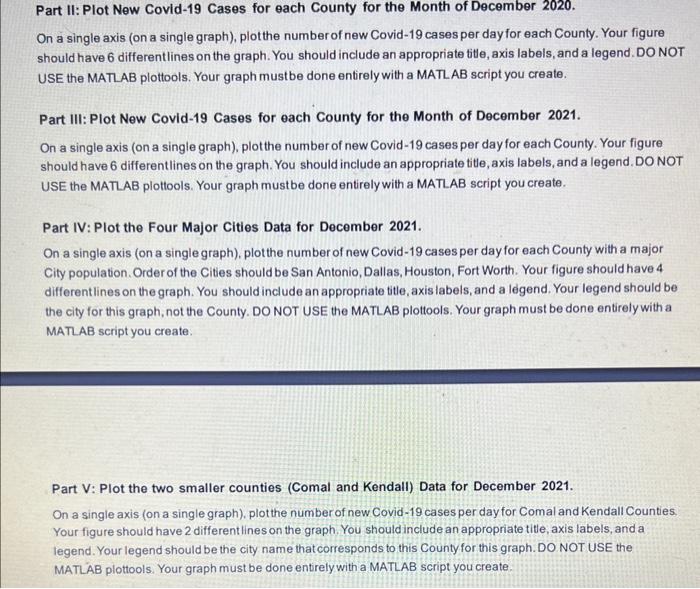
The dataset contains two variables: - TexasCovidDec20 (31x6) holds the new confirmed cases by day for each of the specified counties from December 1,2020 to December 31, 2020. TexasCovidDec21 (31x6) holds the new confirmed cases by day for each of the specified counties from December 1,2021 to December 31,2021 The Covid Cases arrays have 6 Columns: - Column 1 contains new confirmed cases by day of the month for Bexar County - Column 2 contains new confirmed cases by day of the month for Comal County - Column 3 contains new confirmed cases by day of the month for Dallas County - Column 4 contains new confirmed cases by day of the month for Harris County - Column 5 contains new confirmed cases by day of the month for Kendall County - Column 6 contains new confirmed cases by day of the month for Tarrant County The below cities reside in each of the listed Counties: Bexar County - San Antonio Comal County - New Braunfels Dallas County - Dallas Harris County - Houston Kendall County - Boerne Tarrant County - Fort Worth Note: Each row in the arrays representnew cases of Covid-19 reported that day and is not an accumulation of prior cases. This data also may change over time based on the reporting from each county per the Texas Department of Health Services. We pulled this information in January 2022. Part II: Plot New Covid-19 Cases for each County for the Month of December 2020. On a single axis (on a single graph), plotthe number of new Covid-19 cases per day for each County. Your figure should have 6 differentlines on the graph. You should include an appropriate title, axis labels, and a legend. DO NOT USE the MATLAB plottools. Your graph mustbe done entirely with a MATL AB script you create. Part III: Plot New Covid-19 Cases for each County for the Month of December 2021. On a single axis (on a single graph), plotthe number of new Covid-19 cases per day for each County. Your figure should have 6 differentlines on the graph. You should include an appropriate title, axis labels, and a legend.DONOT USE the MATLAB plottools. Your graph mustbe done entirely with a MATLAB script you create. Part IV: Plot the Four Major Cities Data for December 2021. On a single axis (on a single graph), plot the number of new Covid-19 cases per day for each County with a major City population. Order of the Cities should be San Antonio, Dallas, Houston, Fort Worth. Your figure should have 4 differentlines on the graph. You should include an appropriate title, axis labels, and a legend. Your legend should be the city for this graph, not the County. DO NOT USE the MATLAB plottools. Your graph must be done entirely with a MATLAB script you create. Part V: Plot the two smaller counties (Comal and Kendall) Data for December 2021. On a single axis (on a single graph), plotthe number of new Covid-19 cases per day for Comal and Kendall Counties. Your figure should have 2 different lines on the graph. You should include an appropriate title, axis labels, and a legend. Your legend should be the city name thatcorresponds to this County for this graph. DO NOT USE the MATLAB plottools. Your graph must be done entrely with a MATLAB script you create