Please help me fill out the statement of cash flows based on the information below. It is in order as the tabs in my excel spreadsheet. Thank you!!
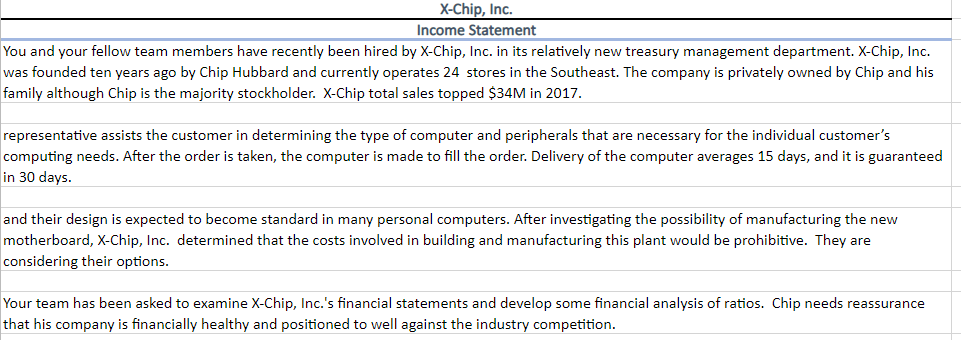

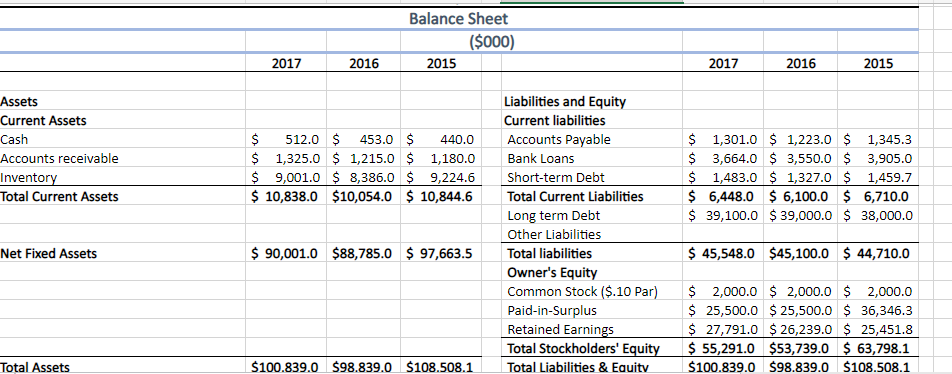


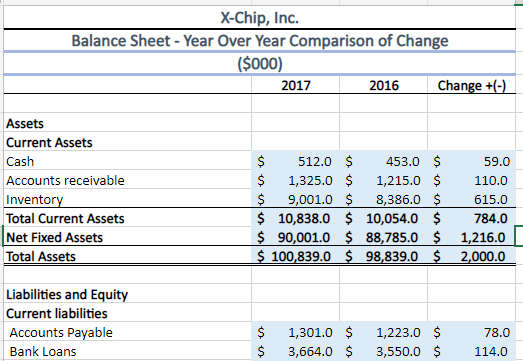
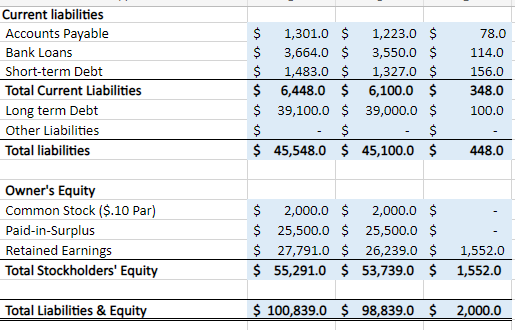
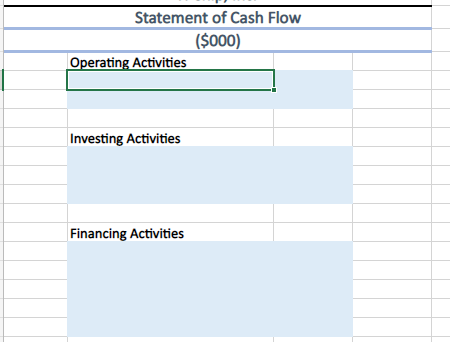
X-Chip, Inc. Income Statement You and your fellow team members have recently been hired by X-Chip, Inc. in its relatively new treasury management department. X-Chip, Inc. was founded ten years ago by Chip Hubbard and currently operates 24 stores in the Southeast. The company is privately owned by Chip and his family although Chip is the majority stockholder. X-Chip total sales topped $34M in 2017. representative assists the customer in determining the type of computer and peripherals that are necessary for the individual customer's computing needs. After the order is taken, the computer is made to fill the order. Delivery of the computer averages 15 days, and it is guaranteed in 30 days. and their design is expected to become standard in many personal computers. After investigating the possibility of manufacturing the new motherboard, X-Chip, Inc. determined that the costs involved in building and manufacturing this plant would be prohibitive. They are considering their options. Your team has been asked to examine X-Chip, Inc.'s financial statements and develop some financial analysis of ratios. Chip needs reassurance that his company is financially healthy and positioned to well against the industry competition. Tab\#1: Explain financial ratios. If X-Chip, Inc. decides to pursue financial for this venture, what will the Bank use the financial ratios for? Tab\#2: Using the 2015-2017 Financial Statements, calculate the required financial ratios. Compare them to the Industry Standards/Averages and then determine if X-Chip, Inc. is in better, or worse financial shape compared to industry standards. Tab\#3: After studying the Balance Sheet, show the change year-over-year between 2017 and 2016. Tab\#4: Prepare a Statement of Cash Flow that will help you explain to Chip how the cash flow changed between years (2016/2017). Tab\#5: Using the Financial Ratios as a basis for your diagnosis, determine X-Chip, Inc.'s current financial shape. With that explain how they are placed in the industry. Finally, give you overall view of the company's health and of how they are positioned against the industry. Ratio Analysis - X-Chip, Inc. \begin{tabular}{|c|c|c|c|c|} \hline & & & Indicate \\ Industry & Better/WorseAverage & ThanIndustryAverage \\ \hline \end{tabular} What This Ratio Says Financial Leverage (Debt) Ratios: Debt to Asset Ratio Debt to Equity Ratio Interest Coverage Ratio \begin{tabular}{|l|l|l|l|l|} 0.45 & 0.46 & 0.41 & 0.25 Worse & Shows how much debt they use to fund their assets \\ 0.82 & 0.84 & 0.70 & 1.00 Better & Shows the companies reliance on its debt \\ \hline 1.79 & 2.09 & 1.56 & 2.50 Worse & Shows how much a company can pay for its interest on current debts \end{tabular} Liquidity Ratios Quick Ratio \begin{tabular}{|l|l|l|l} 0.28 & 0.27 & 0.24 & 1.10 Worse Shows a companys current ability to pay for for its liabilities without help \\ \hline \end{tabular} Current Ratio Shows a companies current assets compared to its liabilities Profitability Ratios Net Return on Assets Net Return on Equity Efficiency Ratios Inventory Turnover \begin{tabular}{|l|l|l} 1.30 & 3.97 & 2.505.20 Worse Shows how good a company is at using its inventory \end{tabular} Compute \# of Common Stocks \begin{tabular}{l} 20,00020,00020,000 \\ \hline \end{tabular} Compute Market Value Ratios Compute Dividends Paid to Stockholders: Current Yr. Retained Earnings Prior Yr. Retained Earnings Change in Retained Earnings Net Income Pr. Year Dividends % of Net Income \begin{tabular}{r|r|r|} \hline 27,791 & 26,339 & 25,452 \\ \hline 26,239 & 25,452 & 24,688 \\ \hline 1,552 & 787 & 764 \\ \hline 2,620 & 1,869 & 1,751 \\ \hline 1,068 & 1,082 & 987 \\ \hline 40.8% & 57.9% & 56.4% \\ \hline \end{tabular} Liabilities and Equity Current liabilities \begin{tabular}{|lrrrrrr} \hline Accounts Payable & $ & 1,301.0 & $ & 1,223.0 & $ & 78.0 \\ \hline Bank Loans & $ & 3,664.0 & $ & 3,550.0 & $ & 114.0 \end{tabular} Current liabilities \begin{tabular}{lrrrrrr} \hline Accounts Payable & $ & 1,301.0 & $ & 1,223.0 & $ & 78.0 \\ Bank Loans & $ & 3,664.0 & $ & 3,550.0 & $ & 114.0 \\ Short-term Debt & $ & 1,483.0 & $ & 1,327.0 & $ & 156.0 \\ \hline Total Current Liabilities & $ & 6,448.0 & $ & 6,100.0 & $ & 348.0 \\ Long term Debt & $ & 39,100.0 & $ & 39,000.0 & $ & 100.0 \\ \hline Other Liabilities & $ & - & $ & - & $ & - \\ \hline Total liabilities & $45,548.0 & $ & 45,100.0 & $ & 448.0 \end{tabular} \begin{tabular}{lrrrrrr} \hline Owner's Equity & & & & & & \\ \hline Common Stock (\$.10 Par) & $ & 2,000.0 & $ & 2,000.0 & $ & - \\ \hline Paid-in-Surplus & $ & 25,500.0 & $ & 25,500.0 & $ & - \\ Retained Earnings & $ & 27,791.0 & $ & 26,239.0 & $ & 1,552.0 \\ \hline Total Stockholders' Equity & $ & 55,291.0 & $ & 53,739.0 & $ & 1,552.0 \\ \hline Total Liabilities \& Equity & & & & & & \\ \hline \hline \end{tabular} Statement of Cash Flow (\$000) Operating Activities Investing Activities Financing Activities Net Increase (Decrease) in Cash


