Please help me fill out "Time and Operation Costs" for myfitnesspal application? This assignment aims to build and defend financial projections for your business idea. This includes estimating units sold, revenue, and costs for the business's first three years (12 Quarters). Thank you, and I will be sure to upvote!
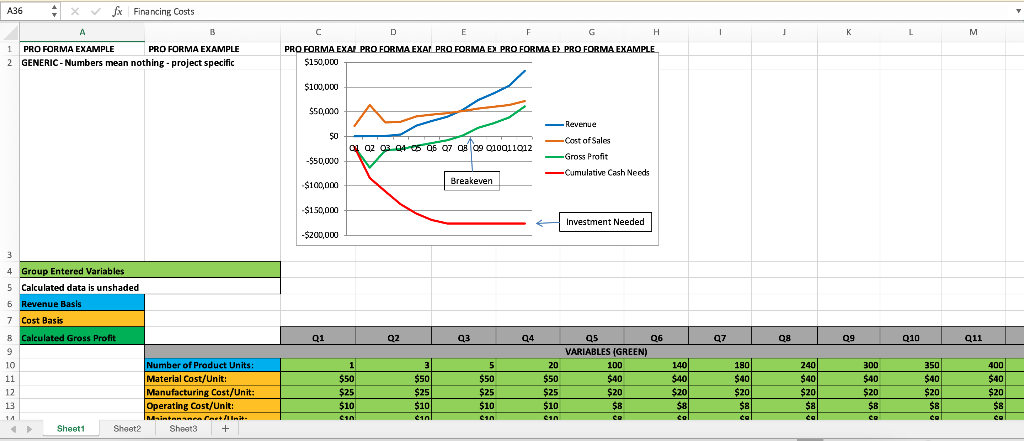
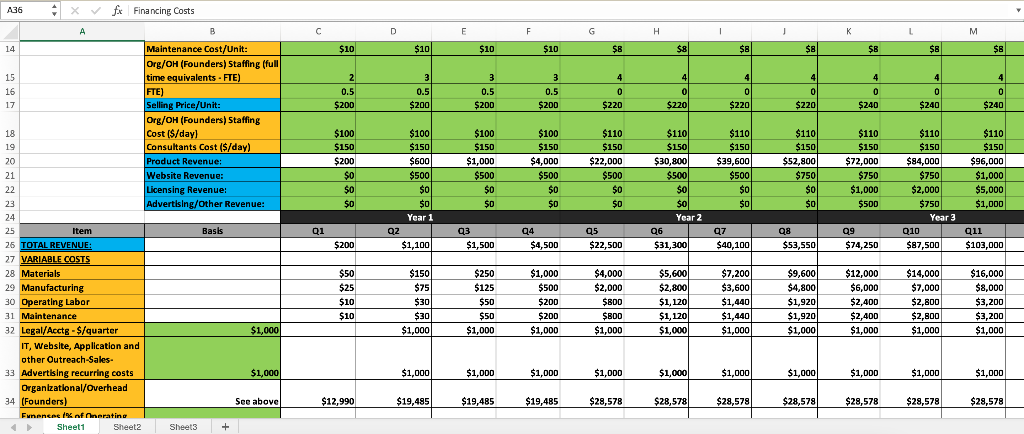
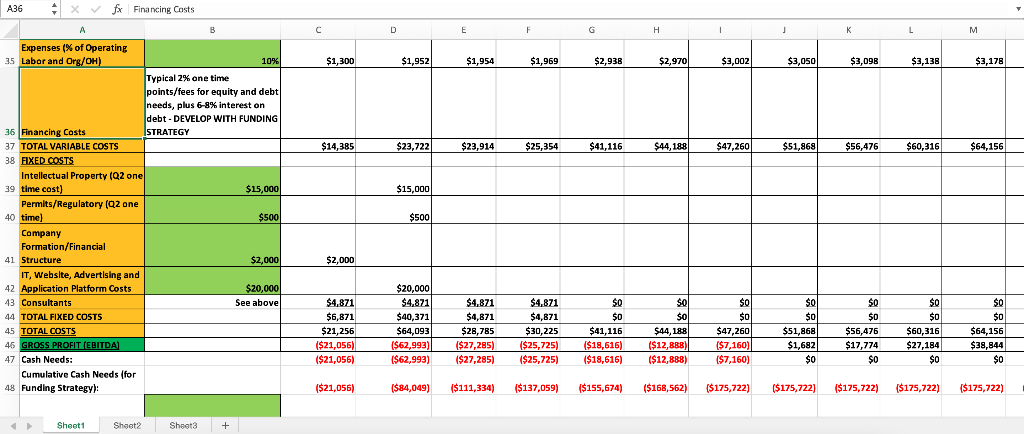
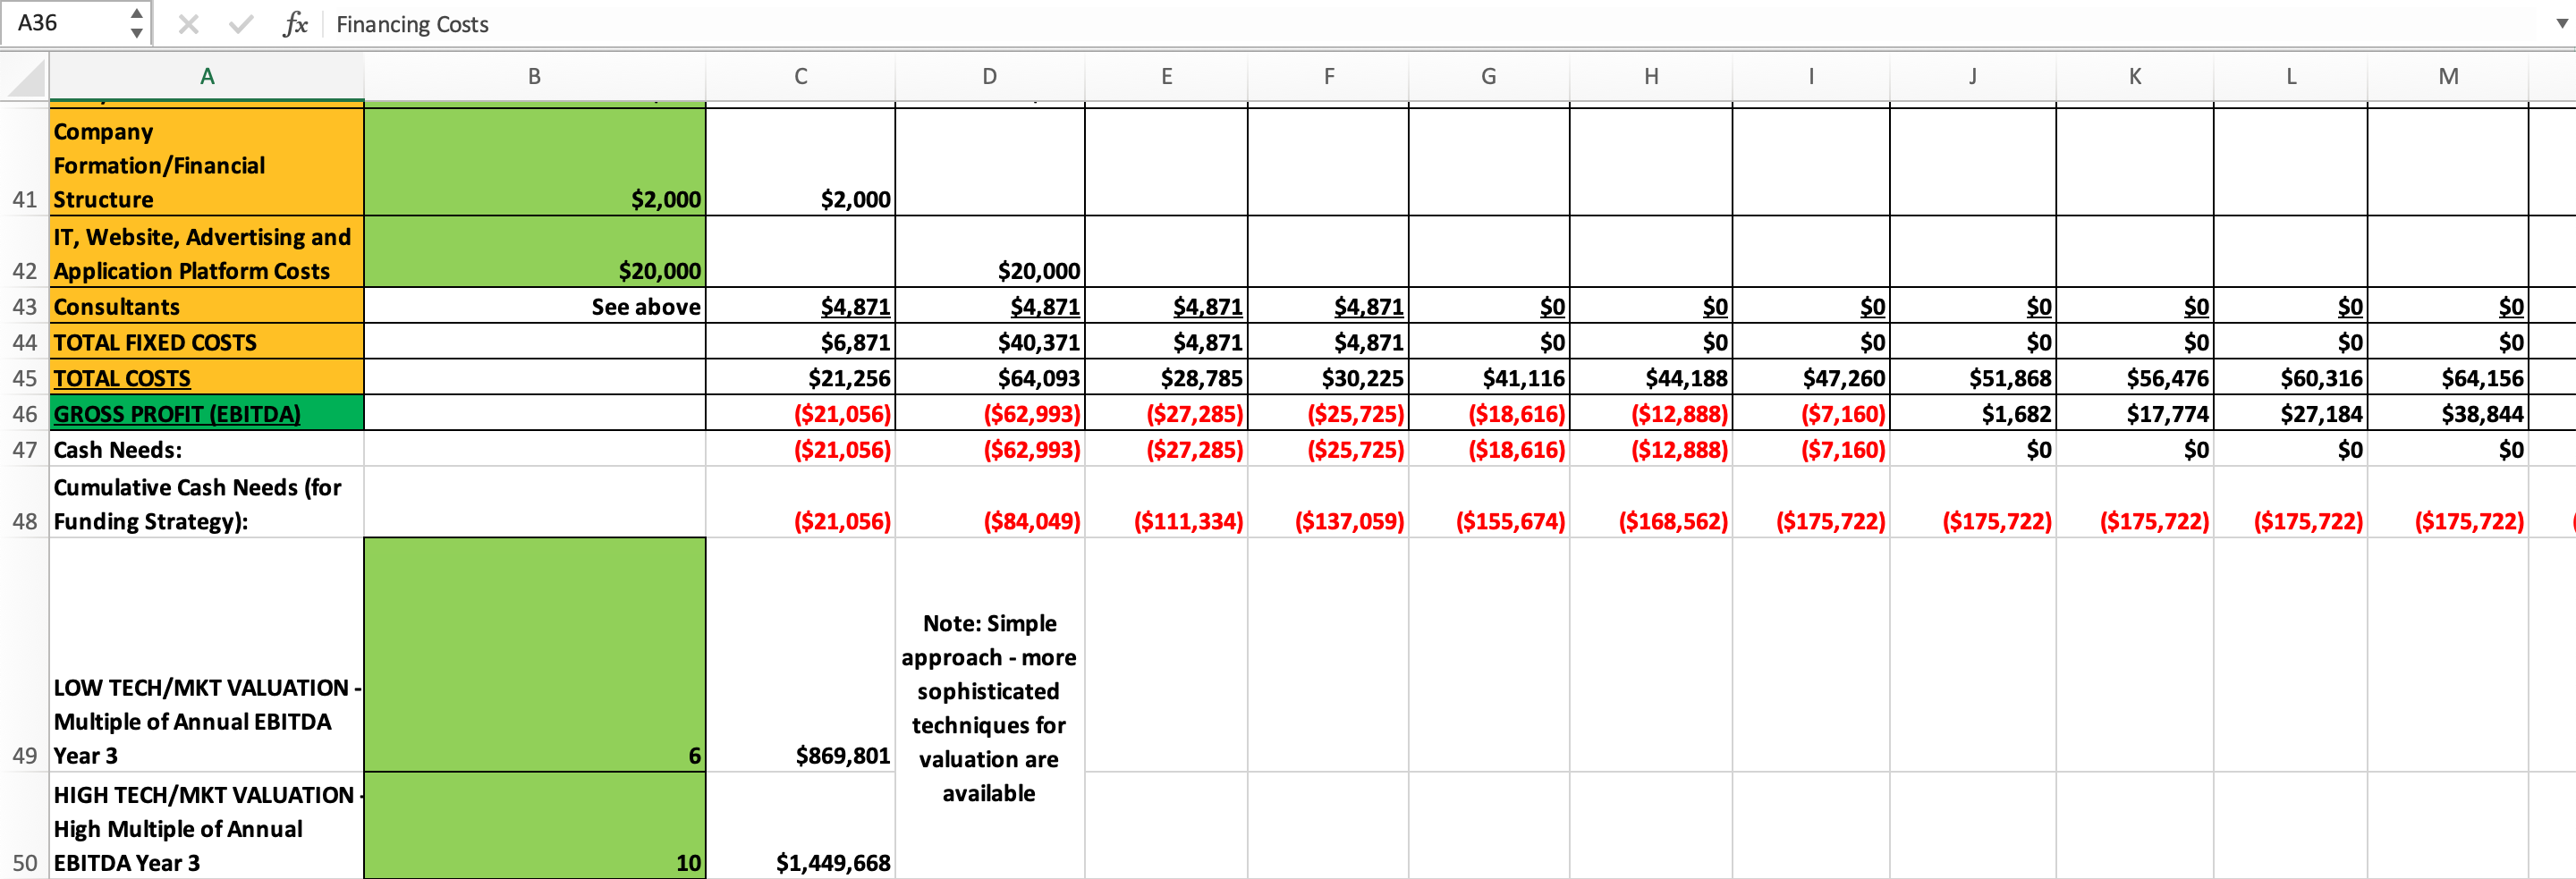
A36 + X A B 1 PRO FORMA EXAMPLE PRO FORMA EXAMPLE 2 GENERIC-Numbers mean nothing - project specific 3 4 Group Entered Variables 5 Calculated data is unshaded 6 Revenue Basis 7 Cost Basis 8 Calculated Gross Profit 9 10 11 12 13 14 Sheet1 fx Financing Costs A Sheet2 Number of Product Units: Material Cost/Unit: Manufacturing Cost/Unit: Operating Cost/Unit: Maintanamon Cast Minit- Sheet3 + C D E F H PRO FORMA EXAI PRO FORMA EXA! PRO FORMA EX PRO FORMA E) PRO FORMA EXAMPLE $150,000 $100,000 $50,000 -Revenue -Cost of Sales 50 01 02 03 04 05 06 07 08 09 010011017 -Gross Profit -$50,000 -Cumulative Cash Needs -$100,000 Breakeven -$150,000 Investment Needed -$200,000 Q1 Q3 Q5 VARIABLES (GREEN) 100 $40 $20 $8 co 1 $50 $25 $10 cin Qz 3 $50 $25 $10 10l 5 $50 $25 $10 cin Q4 20 $50 $25 $10 cin Q6 140 $40 $20 $8 co I Q7 180 $40 $20 $8 co J Q8 240 $40 $20 $8 K Q9 300 $40 $20 $8 co L Q10 350 $40 $20 $8 co M Q11 400 $40 $20 $8 co A36 14 15 995 998 16 17 18 19 20 21 22 X X fx Financing Costs A 23 24 25 Item 26 TOTAL REVENUE: 27 VARIABLE COSTS 28 Materials 29 Manufacturing 30 Operating Labor 31 Maintenance 32 Legal/Acctg-$/quarter IT, Website, Application and other Outreach-Sales- 33 Advertising recurring costs Organizational/Overhead 34 (Founders) Funences (% of Operating Sheet1 4 Sheet2 B Maintenance Cost/Unit: Org/OH (Founders) Staffing (full time equivalents - FTE) FTE) Selling Price/Unit: Org/OH (Founders) Staffing Cost ($/day) Consultants Cost ($/day) Product Revenue: Website Revenue: Licensing Revenue: Advertising/Other Revenue: Basis Sheet3 + $1,000 $1,000 See above $10 2 0.5 $200 $100 $150 $200 $0 $0 $0 $200 $50 $25 $10 $10 $12,990 Q1 D 02 $10 3 0.5 $200 $100 $150 $600 $500 $0 $0 Year 1 $1,100 $150 $75 $30 $30 $1,000 $1,000 $19,485 E $10 03 3 0.5 $200 $100 $150 $1,000 $500 $0 $0 $1,500 $250 $125 $50 $50 $1,000 $1,000 $19,485 F $10 3 0.5 $200 $100 $150 $4,000 $500 $0 $0 $4,500 $1,000 $500 $200 $200 $1,000 $1,000 $19,485 Q4 G $8 4 0 $220 $110 $150 $22,000 $500 $0 $0 05 $22,500 $4,000 $2,000 $800 $800 $1,000 $1,000 $28,578 H $8 4 0 ol $220 $110 $150 $30,800 $500 $0 $0 Year 2 Q6 $31,300 $5,600 $2,800 $1,120 $1,120 $1,000 $1,000 $28,578 I $8 4 0 $220 $110 $150 $39,600 $500 $0 $0 07 $40,100 $7,200 $3,600 $1,440 $1,440 $1,000 $1,000 $28,578 J $8 4 0 $220 $110 $150 $52,800 $750 $0 $0 $53,550 $9,600 $4,800 $1,920 $1,920 $1,000 $1,000 $28,578 08 K $8 4 0 $240 $110 $150 $72,000 $750 $1,000 $500 09 $74,250 $12,000 $6,000 $2,400 $2,400 $1,000 $1,000 $28,578 L $8 4 0 $240 $110 $150 $84,000 $750 $2,000 $750 Year 3 Q10 $87,500 $14.000 $7,000 $2,800 $2,800 $1,000 $1,000 $28,578 M $8 4 0 $240 $110 $150 $96,000 $1,000 $5,000 $1,000 Q11 $103,000 $16,000 $8,000 $3,200 $3,200 $1,000 $1,000 $28,578 + x fx Financing Costs A Expenses (% of Operating A36 35 Labor and Org/OH) 36 Financing Costs 37 TOTAL VARIABLE COSTS 38 FIXED COSTS 39 time cost) 40 time) Intellectual Property (Q2 one Permits/Regulatory (Q2 one Company Formation/Financial 41 Structure IT, Website, Advertising and 42 Application Platform Costs 43 Consultants 44 TOTAL FIXED COSTS 45 TOTAL COSTS 46 GROSS PROFIT (EBITDA) 47 Cash Needs: 48 Funding Strategy): Sheet1 Cumulative Cash Needs (for Sheet2 B 10% Typical 2% one time points/fees for equity and debt needs, plus 6-8% interest on debt - DEVELOP WITH FUNDING STRATEGY $15,000 $500 $2,000 $20,000 See above Shoot3 + $1,300 $14,385 $2,000 $4,871 $6,871 $21,256 ($21,056) ($21,056) ($21,056) D E $1,952 $23,722 $15,000 $500 $20,000 $4,871 $4,871 $40,371 $4,871 $64,093 $28,785 ($62,993) ($27,285) ($62,993) ($27,285) ($84,049) ($111,334) $1,954 $23,914 F H I $1,969 $2,938 $2,970 $3,002 $25,354 $41,116 $44, 188 $47,260 $4,871 50 $0 $4,871 $0 $0 $0 $47,260 ($7,160) $30,225 $0 $44, 188 ($12,888) ($12,888) $41,116 ($25,725) ($18,616) ($25,725) ($18,616) ($7,160) ($137,059) ($155,674) ($168,562) ($175,722) J K L $3,050 $3,098 $3,138 $51,868 $56,476 $60,316 $0 $0 $0 $51,868 $1,682 $0 $0 $0 $56,476 $17,774 $0 $0 $60,316 $27,184 $0 ($175,722) ($175,722) ($175,722) M $3,178 $64,156 $0 $0 $64,156 $38,844 $0 ($175,722) X fx Financing Costs A Company Formation/Financial 41 Structure IT, Website, Advertising and 42 Application Platform Costs 43 Consultants 44 TOTAL FIXED COSTS 45 TOTAL COSTS 46 GROSS PROFIT (EBITDA) 47 Cash Needs: 48 Funding Strategy): A36 Cumulative Cash Needs (for LOW TECH/MKT VALUATION Multiple of Annual EBITDA HIGH TECH/MKT VALUATION High Multiple of Annual 49 Year 3 50 EBITDA Year 3 B $2,000 $20,000 See above 6 10 C $2,000 $4,871 $6,871 $21,256 ($21,056) ($21,056) ($21,056) D E Note: Simple approach - more sophisticated techniques for $869,801 valuation are available $1,449,668 F $20,000 $4,871 $4,871 $4,871 $4,871 $40,371 $4,871 $28,785 $64,093 ($62,993) ($62,993) ($27,285) ($25,725) $30,225 ($27,285) ($25,725) ($84,049) ($111,334) ($137,059) G H $0 $0 $0 $41,116 ($18,616) ($18,616) ($12,888) $0 $44,188 ($12,888) ($155,674) ($168,562) J $0 $0 $47,260 ($7,160) ($7,160) $0 $0 $51,868 $1,682 $0 ($175,722) ($175,722) L $0 $0 $56,476 $17,774 $0 $0 $0 $60,316 $27,184 $0 ($175,722) ($175,722) K M $0 $0 $64,156 $38,844 $0 ($175,722) A36 + X A B 1 PRO FORMA EXAMPLE PRO FORMA EXAMPLE 2 GENERIC-Numbers mean nothing - project specific 3 4 Group Entered Variables 5 Calculated data is unshaded 6 Revenue Basis 7 Cost Basis 8 Calculated Gross Profit 9 10 11 12 13 14 Sheet1 fx Financing Costs A Sheet2 Number of Product Units: Material Cost/Unit: Manufacturing Cost/Unit: Operating Cost/Unit: Maintanamon Cast Minit- Sheet3 + C D E F H PRO FORMA EXAI PRO FORMA EXA! PRO FORMA EX PRO FORMA E) PRO FORMA EXAMPLE $150,000 $100,000 $50,000 -Revenue -Cost of Sales 50 01 02 03 04 05 06 07 08 09 010011017 -Gross Profit -$50,000 -Cumulative Cash Needs -$100,000 Breakeven -$150,000 Investment Needed -$200,000 Q1 Q3 Q5 VARIABLES (GREEN) 100 $40 $20 $8 co 1 $50 $25 $10 cin Qz 3 $50 $25 $10 10l 5 $50 $25 $10 cin Q4 20 $50 $25 $10 cin Q6 140 $40 $20 $8 co I Q7 180 $40 $20 $8 co J Q8 240 $40 $20 $8 K Q9 300 $40 $20 $8 co L Q10 350 $40 $20 $8 co M Q11 400 $40 $20 $8 co A36 14 15 995 998 16 17 18 19 20 21 22 X X fx Financing Costs A 23 24 25 Item 26 TOTAL REVENUE: 27 VARIABLE COSTS 28 Materials 29 Manufacturing 30 Operating Labor 31 Maintenance 32 Legal/Acctg-$/quarter IT, Website, Application and other Outreach-Sales- 33 Advertising recurring costs Organizational/Overhead 34 (Founders) Funences (% of Operating Sheet1 4 Sheet2 B Maintenance Cost/Unit: Org/OH (Founders) Staffing (full time equivalents - FTE) FTE) Selling Price/Unit: Org/OH (Founders) Staffing Cost ($/day) Consultants Cost ($/day) Product Revenue: Website Revenue: Licensing Revenue: Advertising/Other Revenue: Basis Sheet3 + $1,000 $1,000 See above $10 2 0.5 $200 $100 $150 $200 $0 $0 $0 $200 $50 $25 $10 $10 $12,990 Q1 D 02 $10 3 0.5 $200 $100 $150 $600 $500 $0 $0 Year 1 $1,100 $150 $75 $30 $30 $1,000 $1,000 $19,485 E $10 03 3 0.5 $200 $100 $150 $1,000 $500 $0 $0 $1,500 $250 $125 $50 $50 $1,000 $1,000 $19,485 F $10 3 0.5 $200 $100 $150 $4,000 $500 $0 $0 $4,500 $1,000 $500 $200 $200 $1,000 $1,000 $19,485 Q4 G $8 4 0 $220 $110 $150 $22,000 $500 $0 $0 05 $22,500 $4,000 $2,000 $800 $800 $1,000 $1,000 $28,578 H $8 4 0 ol $220 $110 $150 $30,800 $500 $0 $0 Year 2 Q6 $31,300 $5,600 $2,800 $1,120 $1,120 $1,000 $1,000 $28,578 I $8 4 0 $220 $110 $150 $39,600 $500 $0 $0 07 $40,100 $7,200 $3,600 $1,440 $1,440 $1,000 $1,000 $28,578 J $8 4 0 $220 $110 $150 $52,800 $750 $0 $0 $53,550 $9,600 $4,800 $1,920 $1,920 $1,000 $1,000 $28,578 08 K $8 4 0 $240 $110 $150 $72,000 $750 $1,000 $500 09 $74,250 $12,000 $6,000 $2,400 $2,400 $1,000 $1,000 $28,578 L $8 4 0 $240 $110 $150 $84,000 $750 $2,000 $750 Year 3 Q10 $87,500 $14.000 $7,000 $2,800 $2,800 $1,000 $1,000 $28,578 M $8 4 0 $240 $110 $150 $96,000 $1,000 $5,000 $1,000 Q11 $103,000 $16,000 $8,000 $3,200 $3,200 $1,000 $1,000 $28,578 + x fx Financing Costs A Expenses (% of Operating A36 35 Labor and Org/OH) 36 Financing Costs 37 TOTAL VARIABLE COSTS 38 FIXED COSTS 39 time cost) 40 time) Intellectual Property (Q2 one Permits/Regulatory (Q2 one Company Formation/Financial 41 Structure IT, Website, Advertising and 42 Application Platform Costs 43 Consultants 44 TOTAL FIXED COSTS 45 TOTAL COSTS 46 GROSS PROFIT (EBITDA) 47 Cash Needs: 48 Funding Strategy): Sheet1 Cumulative Cash Needs (for Sheet2 B 10% Typical 2% one time points/fees for equity and debt needs, plus 6-8% interest on debt - DEVELOP WITH FUNDING STRATEGY $15,000 $500 $2,000 $20,000 See above Shoot3 + $1,300 $14,385 $2,000 $4,871 $6,871 $21,256 ($21,056) ($21,056) ($21,056) D E $1,952 $23,722 $15,000 $500 $20,000 $4,871 $4,871 $40,371 $4,871 $64,093 $28,785 ($62,993) ($27,285) ($62,993) ($27,285) ($84,049) ($111,334) $1,954 $23,914 F H I $1,969 $2,938 $2,970 $3,002 $25,354 $41,116 $44, 188 $47,260 $4,871 50 $0 $4,871 $0 $0 $0 $47,260 ($7,160) $30,225 $0 $44, 188 ($12,888) ($12,888) $41,116 ($25,725) ($18,616) ($25,725) ($18,616) ($7,160) ($137,059) ($155,674) ($168,562) ($175,722) J K L $3,050 $3,098 $3,138 $51,868 $56,476 $60,316 $0 $0 $0 $51,868 $1,682 $0 $0 $0 $56,476 $17,774 $0 $0 $60,316 $27,184 $0 ($175,722) ($175,722) ($175,722) M $3,178 $64,156 $0 $0 $64,156 $38,844 $0 ($175,722) X fx Financing Costs A Company Formation/Financial 41 Structure IT, Website, Advertising and 42 Application Platform Costs 43 Consultants 44 TOTAL FIXED COSTS 45 TOTAL COSTS 46 GROSS PROFIT (EBITDA) 47 Cash Needs: 48 Funding Strategy): A36 Cumulative Cash Needs (for LOW TECH/MKT VALUATION Multiple of Annual EBITDA HIGH TECH/MKT VALUATION High Multiple of Annual 49 Year 3 50 EBITDA Year 3 B $2,000 $20,000 See above 6 10 C $2,000 $4,871 $6,871 $21,256 ($21,056) ($21,056) ($21,056) D E Note: Simple approach - more sophisticated techniques for $869,801 valuation are available $1,449,668 F $20,000 $4,871 $4,871 $4,871 $4,871 $40,371 $4,871 $28,785 $64,093 ($62,993) ($62,993) ($27,285) ($25,725) $30,225 ($27,285) ($25,725) ($84,049) ($111,334) ($137,059) G H $0 $0 $0 $41,116 ($18,616) ($18,616) ($12,888) $0 $44,188 ($12,888) ($155,674) ($168,562) J $0 $0 $47,260 ($7,160) ($7,160) $0 $0 $51,868 $1,682 $0 ($175,722) ($175,722) L $0 $0 $56,476 $17,774 $0 $0 $0 $60,316 $27,184 $0 ($175,722) ($175,722) K M $0 $0 $64,156 $38,844 $0 ($175,722)