Answered step by step
Verified Expert Solution
Link Copied!

Question

1 Approved Answer

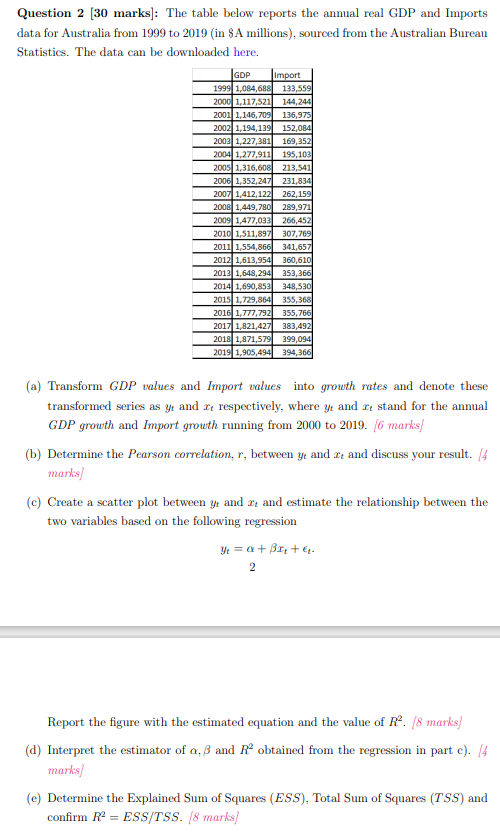
Please help me find the attached answer. Question 2 [30 marks]: The table below reports the annual real GDP and Imports data for Australia from

Please help me find the attached answer.

image text in transcribed
Question 2 [30 marks]: The table below reports the annual real GDP and Imports data for Australia from 1999 to 2019 (in $A millions), sourced from the Australian Bureau Statistics. The data can be downloaded here. Import 1999 1,084,688 138,559 2000 1,117,521 144,24 2001 1,146,705 136,975 2002 1,194,139 152,084 2003 1,227,381 169,352 2004 1,277,911 195,10 2005 1,316,608 213,541 2006 , 352,247 231,834 2007 1,412,122 262,159 2008 1,449,780 289,971 2009 1,477,033 266,452 2010 1,511,897 107,769 2011 1,554,866 341,657 2012 1,613,954 160,610 2013 1,648,294 353,366 2014 1,690,853 348,530 2015 1,729,864 355,368 2016 1,777,792 355,766 2017 1,821,427 383,492 2018 1,871,579 399,094 2019 1,905,494 394,360 (a) Transform GDP values and Import values into growth rates and denote these transformed series as yr and re respectively, where yr and r, stand for the annual GDP growth and Import growth running from 2000 to 2019. (6 marks) (b) Determine the Pearson correlation, r, between y and z, and discuss your result. /4 marks (c) Create a scatter plot between yr and z, and estimate the relationship between the two variables based on the following regression 2 Report the figure with the estimated equation and the value of R". (8 marks) (d) Interpret the estimator of o, S and R" obtained from the regression in part c). /4 marks (e) Determine the Explained Sum of Squares (ESS), Total Sum of Squares (755) and confirm R = ESS/TSS. /8 marks)

Step by Step Solution

There are 3 Steps involved in it

Step: 1

blur-text-image

Get Instant Access to Expert-Tailored Solutions

See step-by-step solutions with expert insights and AI powered tools for academic success

Step: 2

blur-text-image

Step: 3

blur-text-image

Ace Your Homework with AI

Get the answers you need in no time with our AI-driven, step-by-step assistance

Get Started

Recommended Textbook for

How To Prove It A Structured Approach

Authors: Daniel J Velleman

2nd Edition

0511159439, 9780511159435

More Books

Students also viewed these Mathematics questions

Question

Distinguish between filtering and interpreting. (Objective 2)

Answered: 1 week ago