

Question
please help me on the case! develop a simulation model to analyze the various alternatives that American Airlines has for insuring its fleet. answer the
please help me on the case!
develop a simulation model to analyze the various alternatives that American Airlines has for insuring its fleet.
answer the specific questions at the end of the case
calculate distributions for the total costs under different insurance plans.
prepare a table describing the statistics of these distributions (e.g., using Analyze, Extract Data, Statistics) and an overlay chart comparing them.
prepare a brief write-up (one paragraph) describing which plan you recommend and why.
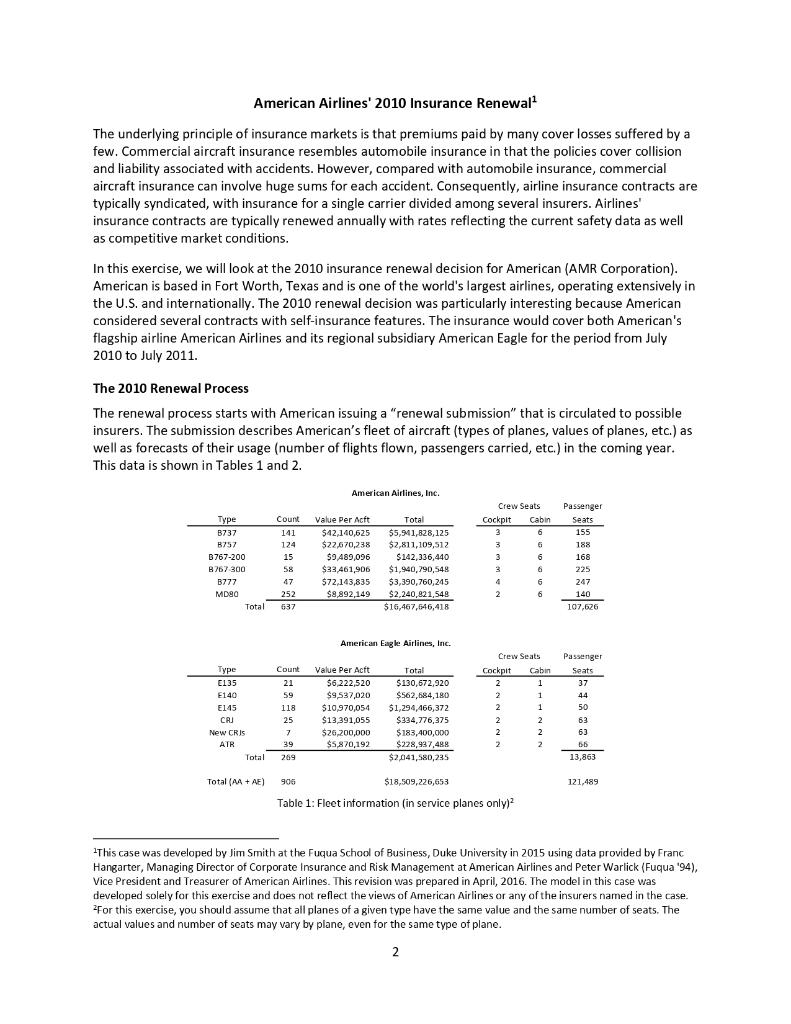
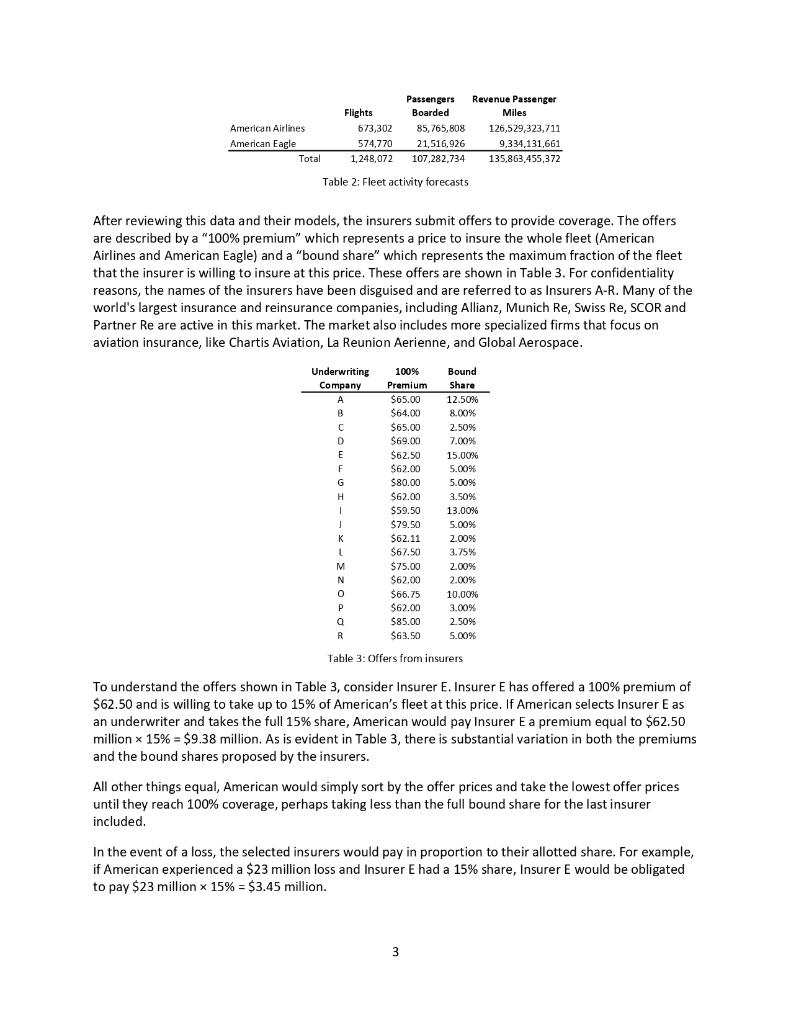
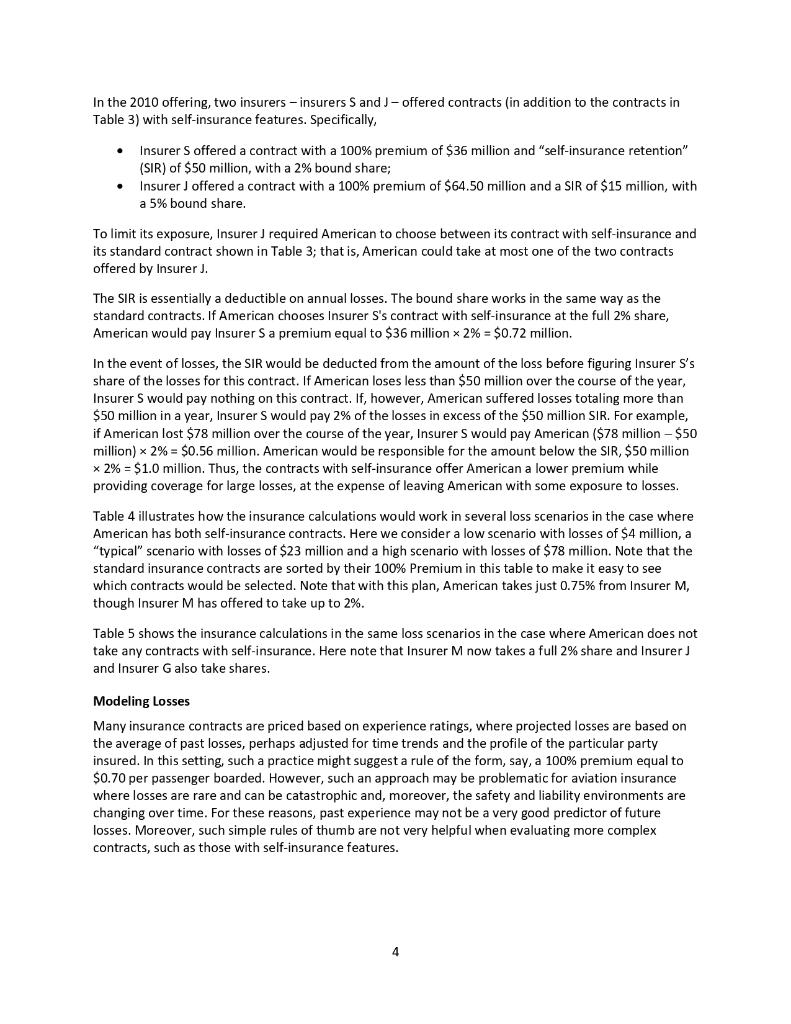
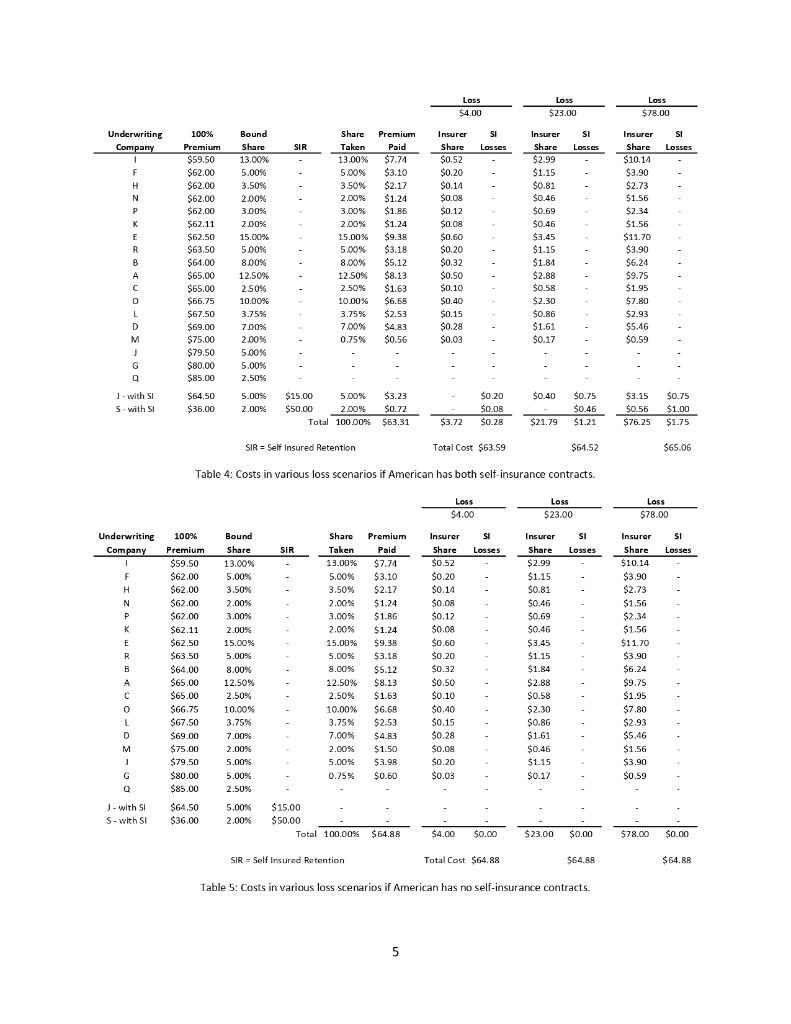
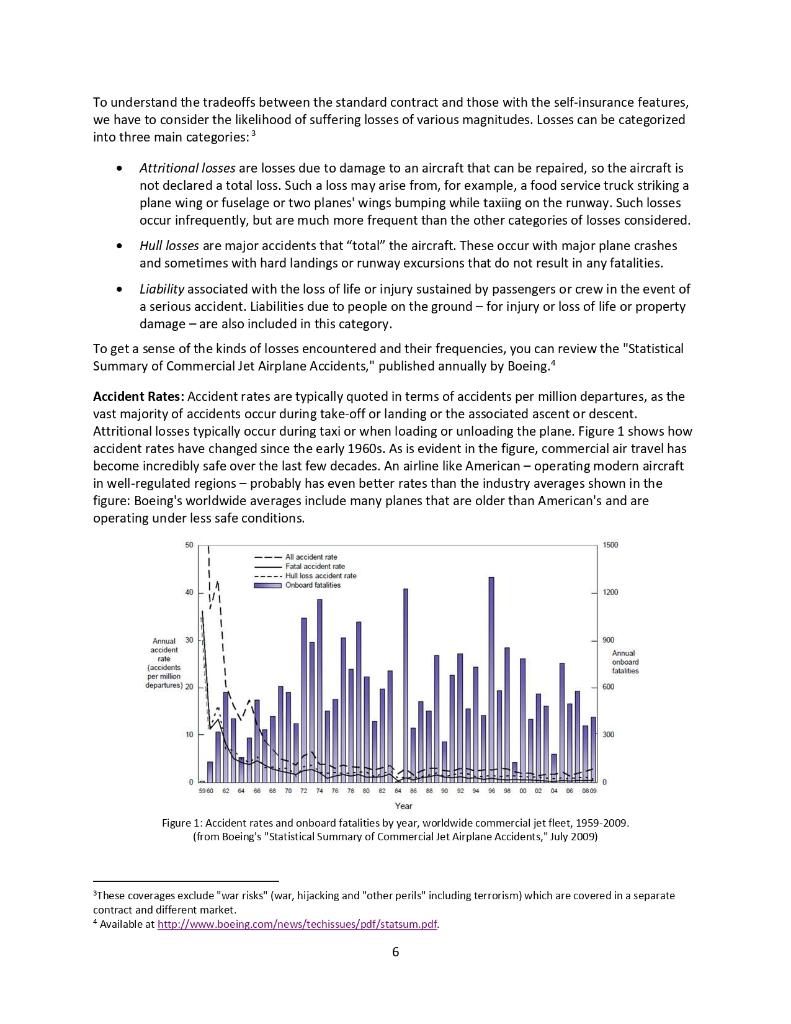
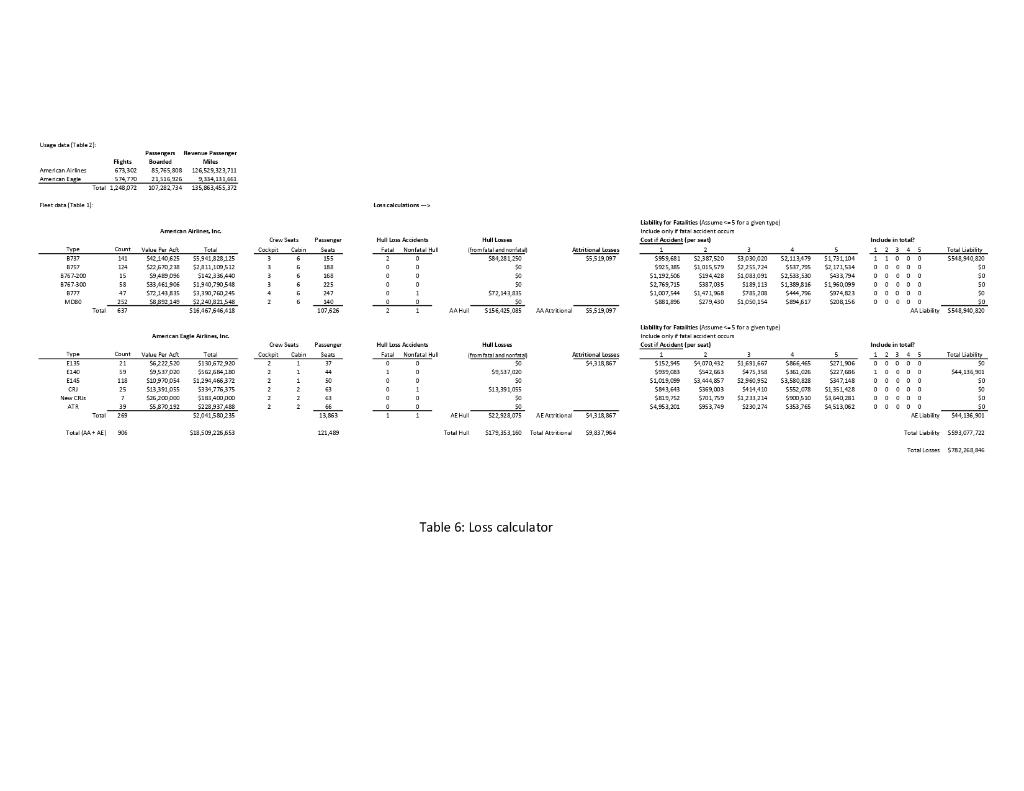
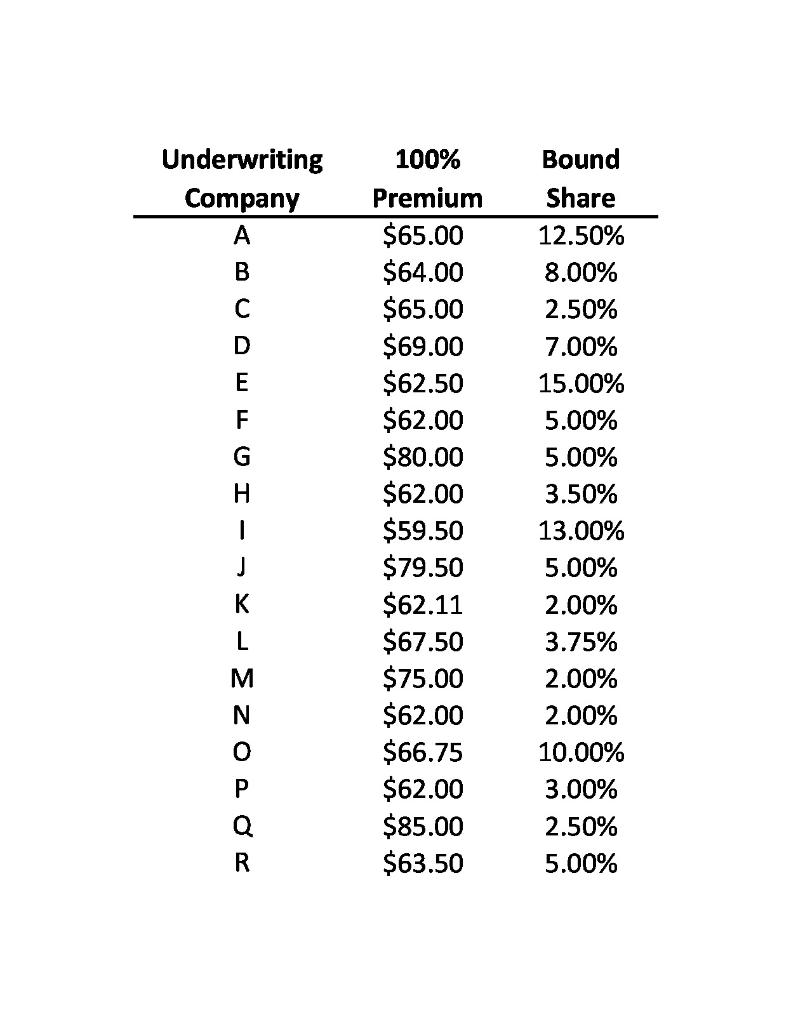
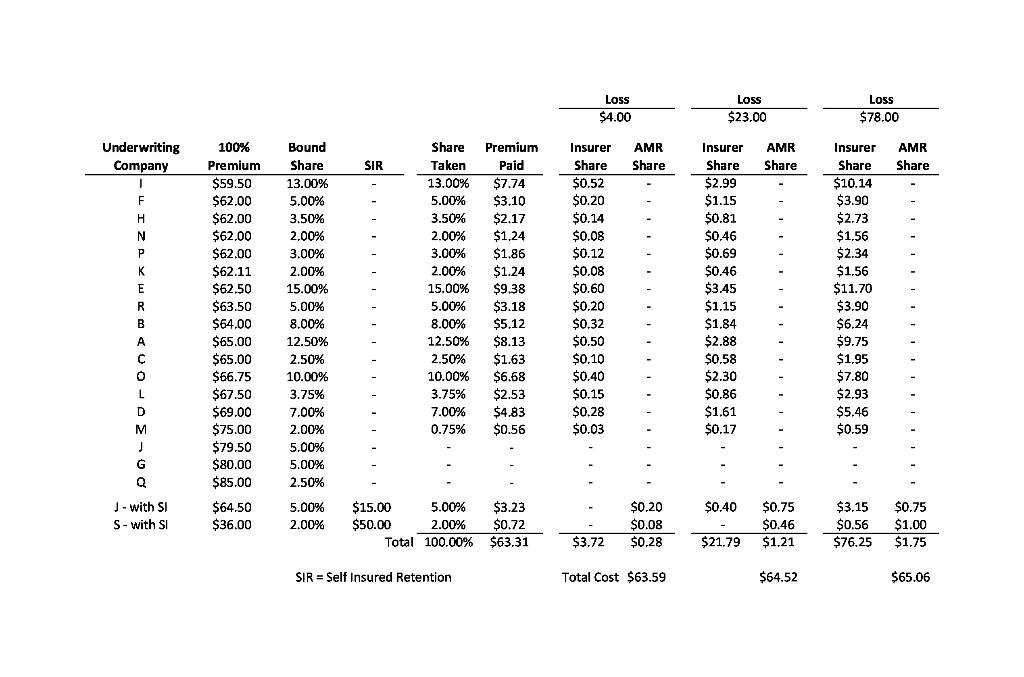
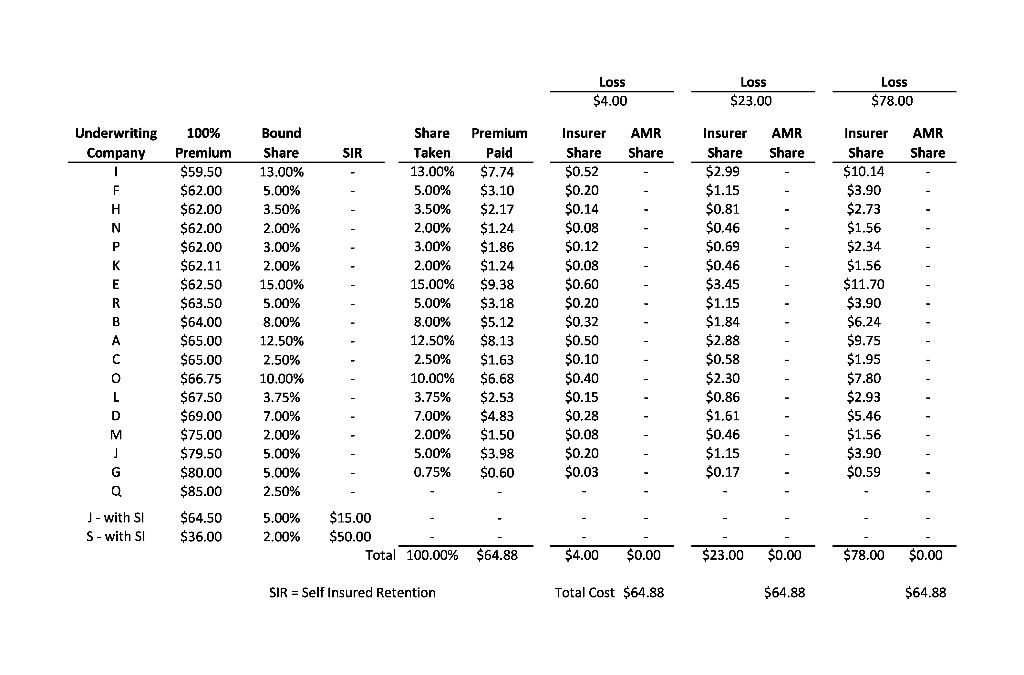
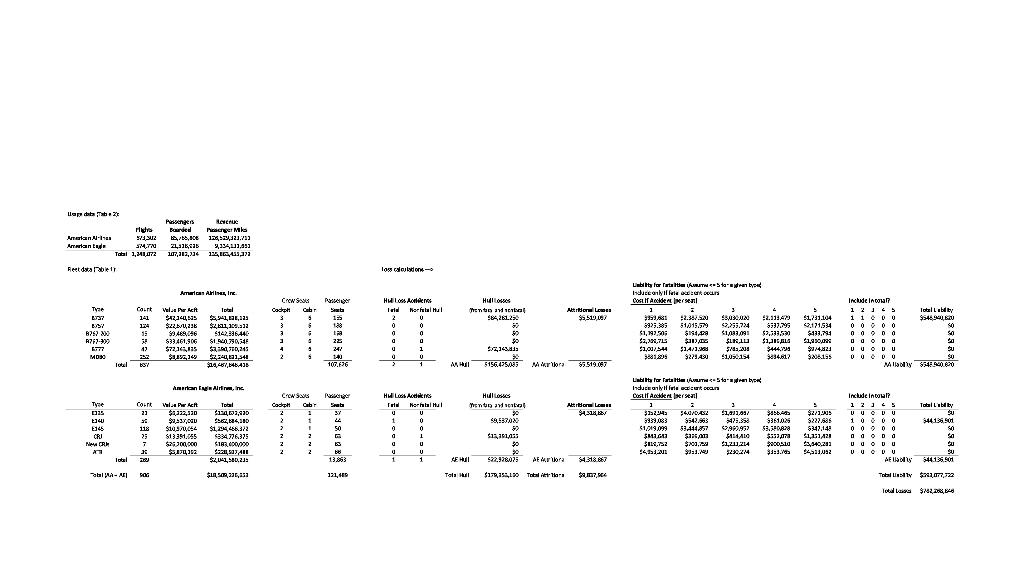
American Airlines' 2010 Insurance Renewal 1 The underlying principle of insurance markets is that premiums paid by many cover losses suffered by a few. Commercial aircraft insurance resembles automobile insurance in that the policies cover collision and liability associated with accidents. However, compared with automobile insurance, commercial aircraft insurance can involve huge sums for each accident. Consequently, airline insurance contracts are typically syndicated, with insurance for a single carrier divided among several insurers. Airlines' insurance contracts are typically renewed annually with rates reflecting the current safety data as well as competitive market conditions. In this exercise, we will look at the 2010 insurance renewal decision for American (AMR Corporation). American is based in Fort Worth, Texas and is one of the world's largest airlines, operating extensively in the U.S. and internationally. The 2010 renewal decision was particularly interesting because American considered several contracts with self-insurance features. The insurance would cover both American's flagship airline American Airlines and its regional subsidiary American Eagle for the period from July 2010 to July 2011. The 2010 Renewal Process The renewal process starts with American issuing a "renewal submission" that is circulated to possible insurers. The submission describes American's fleet of aircraft (types of planes, values of planes, etc.) as well as forecasts of their usage (number of flights flown, passengers carried, etc.) in the coming year. This data is shown in Tables 1 and 2. Table 1: Fleet information (in service planes only) 2 1This case was developed by Jim Smith at the Fuqua School of Business, Duke University in 2015 using data provided by Franc Hangarter, Managing Director of Corporate Insurance and Risk Management at American Airlines and Peter Warlick (Fuqua '94), Vice President and Treasurer of American Airlines. This revision was prepared in April, 2016. The model in this case was developed solely for this exercise and does not reflect the views of American Airlines or any of the insurers named in the case. 2 For this exercise, you should assume that all planes of a given type have the same value and the same number of seats. The actual values and number of seats may vary by plane, even for the same type of plane. 2 Table 2; Fleet activity forecasts After reviewing this data and their models, the insurers submit offers to provide coverage. The offers are described by a "100\% premium" which represents a price to insure the whole fleet (American Airlines and American Eagle) and a "bound share" which represents the maximum fraction of the fleet that the insurer is willing to insure at this price. These offers are shown in Table 3. For confidentiality reasons, the names of the insurers have been disguised and are referred to as Insurers A-R. Many of the world's largest insurance and reinsurance companies, including Allianz, Munich Re, Swiss Re, SCOR and Partner Re are active in this market. The market also includes more specialized firms that focus on aviation insurance, like Chartis Aviation, La Reunion Aerienne, and Global Aerospace. To understand the offers shown in Table 3, consider Insurer E. Insurer E has offered a 100\% premium of $62.50 and is willing to take up to 15% of American's fleet at this price. If American selects Insurer E as an underwriter and takes the full 15% share, American would pay Insurer E a premium equal to $62.50 million 15%=$9.38 million. As is evident in Table 3 , there is substantial variation in both the premiums and the bound shares proposed by the insurers. All other things equal, American would simply sort by the offer prices and take the lowest offer prices until they reach 100% coverage, perhaps taking less than the full bound share for the last insurer included. In the event of a loss, the selected insurers would pay in proportion to their allotted share. For example, if American experienced a $23 million loss and Insurer E had a 15% share, Insurer E would be obligated to pay $23 million 15%=$3.45 million. In the 2010 offering, two insurers - insurers S and J - offered contracts (in addition to the contracts in Table 3) with self-insurance features. Specifically, - Insurer S offered a contract with a 100% premium of $36 million and "self-insurance retention" (SIR) of $50 million, with a 2% bound share; - Insurer J offered a contract with a 100% premium of $64.50 million and a SIR of $15 million, with a 5% bound share. To limit its exposure, Insurer J required American to choose between its contract with self-insurance and its standard contract shown in Table 3; that is, American could take at most one of the two contracts offered by Insurer J. The SIR is essentially a deductible on annual losses. The bound share works in the same way as the standard contracts. If American chooses Insurer S's contract with self-insurance at the full 2% share, American would pay Insurer S a premium equal to $36 million 2%=$0.72 million. In the event of losses, the SIR would be deducted from the amount of the loss before figuring Insurer S's share of the losses for this contract. If American loses less than $50 million over the course of the year, Insurer S would pay nothing on this contract. If, however, American suffered losses totaling more than $50 million in a year, Insurer $ would pay 2% of the losses in excess of the $50 million SIR. For example, if American lost $78 million over the course of the year, Insurer $ would pay American (\$78 million - $50 million )2%=$0.56 million. American would be responsible for the amount below the SIR, $50 million 2%=$1.0 million. Thus, the contracts with self-insurance offer American a lower premium while providing coverage for large losses, at the expense of leaving American with some exposure to losses. Table 4 illustrates how the insurance calculations would work in several loss scenarios in the case where American has both self-insurance contracts. Here we consider a low scenario with losses of $4 million, a "typical" scenario with losses of $23 million and a high scenario with losses of $78 million. Note that the standard insurance contracts are sorted by their 100% Premium in this table to make it easy to see which contracts would be selected. Note that with this plan, American takes just 0.75% from Insurer M, though Insurer M has offered to take up to 2%. Table 5 shows the insurance calculations in the same loss scenarios in the case where American does not take any contracts with self-insurance. Here note that Insurer M now takes a full 2% share and Insurer J and Insurer G also take shares. Modeling Losses Many insurance contracts are priced based on experience ratings, where projected losses are based on the average of past losses, perhaps adjusted for time trends and the profile of the particular party insured. In this setting, such a practice might suggest a rule of the form, say, a 100% premium equal to $0.70 per passenger boarded. However, such an approach may be problematic for aviation insurance where losses are rare and can be catastrophic and, moreover, the safety and liability environments are changing over time. For these reasons, past experience may not be a very good predictor of future losses. Moreover, such simple rules of thumb are not very helpful when evaluating more complex contracts, such as those with self-insurance features. Table 4: Costs in various loss scenarios if American has both self-insurance contracts. Table 5: Costs in various loss scenarios if American has no self-insurance contracts. To understand the tradeoffs between the standard contract and those with the self-insurance features, we have to consider the likelihood of suffering losses of various magnitudes. Losses can be categorized into three main categories: 3 - Attritional losses are losses due to damage to an aircraft that can be repaired, so the aircraft is not declared a total loss. Such a loss may arise from, for example, a food service truck striking a plane wing or fuselage or two planes' wings bumping while taxiing on the runway. Such losses occur infrequently, but are much more frequent than the other categories of losses considered. - Hull losses are major accidents that "total" the aircraft. These occur with major plane crashes and sometimes with hard landings or runway excursions that do not result in any fatalities. - Liability associated with the loss of life or injury sustained by passengers or crew in the event of a serious accident. Liabilities due to people on the ground - for injury or loss of life or property damage - are also included in this category. To get a sense of the kinds of losses encountered and their frequencies, you can review the "Statistical Summary of Commercial Jet Airplane Accidents," published annually by Boeing. 4 Accident Rates: Accident rates are typically quoted in terms of accidents per million departures, as the vast majority of accidents occur during take-off or landing or the associated ascent or descent. Attritional losses typically occur during taxi or when loading or unloading the plane. Figure 1 shows how accident rates have changed since the early 1960s. As is evident in the figure, commercial air travel has become incredibly safe over the last few decades. An airline like American - operating modern aircraft in well-regulated regions - probably has even better rates than the industry averages shown in the figure: Boeing's worldwide averages include many planes that are older than American's and are operating under less safe conditions. Figure 1: Accident rates and onboard fatalities by year, worldwide commercial jet fleet, 1959-2009. (from Boeing's "Statist ical Summary of Commercial Jet Airplane Accidents," July 2009) "These coverages exclude "war risks" (war, hijacking and "other perils" including terrorism) which are covered in a separate contract and different market. 4 Available at http://www.boeing.comews/techissues/pdf/statsum. pdt. Despite these advances in safety, losses may occur and to evaluate insurance policies, we need to think about accident rates. For the purposes of this exercise, assume: - Hull loss accidents with fatalities occur at a rate of 0.15 accidents per million flights. 5 - Hull loss accidents without fatalities occur at a rate of 0.17 accidents per million flights. These rates can be compared to worldwide averages of 0.42 and 0.37 in the 2009 Boeing statistical summary. These rates are hard to estimate and different insurers may make different assumptions about these rates (as well as other assumptions in the loss model). This is one of the reasons for the variations in the offers shown in Table 3. To simplify the model, you may also assume: - All hull loss accidents result in 100% loss of the value of the plane. - Each American Airline plane has the same number of departures. - Each American Eagle plane has the same number of departures. The total number of departures for American Airlines and American Eagle are shown in Table 2. Liability Losses: Although plane travel has grown much safer in recent years, from the insurer's perspective, this increase in safety has been partially offset by increasing awards to accident victims. Before 1999, international treaties (dating back to the Warsaw Convention of 1929) limited airlines' exposure in order to foster growth of the commercial airline industry. However, the 1999 Montreal Convention treaty removed all limits on personal liability. In practice, the damages awarded will vary by jurisdiction and the specific passenger involved. This makes liability losses resulting from fatal accidents difficult to predict and model: there is uncertainty about the number of people lost in the accident, the damage to people and property not on the aircraft, about the settlement or court awards to those injured or killed (or their families or estates) in an accident, as well as how liability might be shared with other parties (e.g., airline manufacturers). Rather than model all of the uncertainties associated with liability separately, we will simplify things for this exercise by modeling the average liability per seat (passengers + crew) on the aircraft. Specifically, assume that: - No liability is incurred in accidents without fatalities. - In the event of a fatal accident, the liability per seat on the aircraft involved is log-normally distributed with mean of $1.9 million and standard deviation of $2.0 million. (Location = 0 ) The log-normal distribution is widely used in situations where the possible values are bounded on the left (typically by 0 ) and positively skewed, meaning there is some chance of large positive values. Here the liability could be quite large depending on the nature of the accident. 5 To put this rate into perspective, if someone were to take one flight per day, the expected time before being involved in a fatal accident is 18,264 vears. Moreover, on average, half of all passengers involved in fatal accidents survive, so the expected time before this frequent flyer would be killed in a fatal accident would be approximately 36,500 years. Attritional Losses: Finally, we have to consider attritional losses. Rather than model the occurrence of individual accidents, because attritional losses are more frequent and better understood, we will simply estimate the total attritional losses for the American Airlines and American Eagle fleets based on past experience. You may assume: - The total attritional losses for American Airlines is log-normally distributed with mean $4.5 million and standard deviation $2.0 million. (Location =0 ) - The total attritional losses for American Eagle is log-normally distributed with mean $3.8 million and standard deviation $2.0 million. (Location =0 ) The log-normal distribution is used here for the same reasons it was used in modeling liability above: the losses are bounded below by zero and are positively skewed because there could be several large attritional losses in a given year. Loss Calculator: Table 6 shows an example loss scenario for the year. This example is purely illustrative: it is extremely unlikely that American would experience this many major accidents in one year. In this scenario, there are 3 hull loss accidents with fatalities, 2 involving B737s and 1 involving an E140. In addition, there are 2 hull loss accidents without fatalities, involving a B777 and a CRJ. The hull losses shown in Table 6 reflect the number of accidents and the values of the planes lost. The attritional losses shown in Table 6 are randomly generated figures, drawn from the distributions described above. For the liability calculations, there are "per seat" liability cells for up to 5 fatal accidents per plane type," but only the values corresponding to the actual number of fatal accidents are used. The logic for these calculations is determined by the "Include in total?" columns: these cells are 1 if the indicated accident occurred and zero otherwise. For example, for the per seat liability losses of $959k and $2.387M are used for the 2 B737 fatal accidents, respectively, and the $939k per seat liability is used for the E140 fatal accident. These per-seat liabilities were randomly generated from the distributions described above. The per-seat liabilities costs for the other aircraft types are not relevant in this scenario and are not included in the total liability (e.g., there are no losses of B757s in this scenario). The worksheet "Table 6 (Loss calculations)" in Excel model does the calculations shown in Table 6, using this scenario shown in Table 6 as a base case. You need to add appropriate CB assumptions to this worksheet to model the uncertainties about the various losses (as described above) and link this model to the insurance calculations to evaluate different insurance plans. 6 The cutoff of 5 is quite conservative: the probability having 6 or more fatal accidents of one plane type is extremely small. Questions: Define the total cost associated with an insurance plan (i.e., a set of policies providing 100% coverage for American's fleet) to be the total premiums paid plus American's share of the losses for any plan that includes some element of self-insurance. 1. Evaluate American's total costs and exposure to risks for four plans: (i) with both Insurers S and J 's contracts with self-insurance; (ii) with Insurer S's contract with self-insurance, but not Insurer J's contract with selfinsurance; (iii) with Insurer J's contract with self-insurance, but not Insurer S's contract; and (iv) with just the available insurance contracts that do not have self-insurance features. Build an overlay chart comparing the cumulative distributions for the total costs for each plan and show the statistics (mean, standard deviation, etc.) for the total costs for each plan. Which plan do you recommend and why? 2. Though hull and attritional losses may be substantial, a large carrier like American could probably absorb such losses without seriously disrupting its operations. On the other hand, the liabilities associated with a major accident involving many fatalities could easily amount to hundreds of millions in losses (or more) and bankrupt even a large carrier. With this in mind, suppose that American could obtain a policy from another insurer (or group of insurers) that offers full coverage of all liability losses, but no coverage of hull or attritional losses. Based on recent bids for similar plans, American's insurance brokers estimate they can obtain full "liability only" coverage for a premium of $45 million. For this part of the exercise, compare the following options for American: (i) The plan from part 1 (i), including both S and J 's contracts with self-insurance. (ii) Liability only coverage. (iii) Full self-insurance, i.e., no coverage from any insurer. (American was not considering this, but this option provides a relevant benchmark.) Which of these options would you recommend American pursue and why? Provide overlay charts and statistics (as in part 1) to support your answer. Table 6: Loss calculator \begin{tabular}{ccc} UnderwritingCompany & 100%Premium & BoundShare \\ \hline A & $65.00 & 12.50% \\ B & $64.00 & 8.00% \\ C & $65.00 & 2.50% \\ D & $69.00 & 7.00% \\ E & $62.50 & 15.00% \\ F & $62.00 & 5.00% \\ G & $80.00 & 5.00% \\ H & $62.00 & 3.50% \\ I & $59.50 & 13.00% \\ J & $79.50 & 5.00% \\ K & $62.11 & 2.00% \\ L & $67.50 & 3.75% \\ M & $75.00 & 2.00% \\ N & $62.00 & 2.00% \\ O & $66.75 & 10.00% \\ P & $62.00 & 3.00% \\ Q & $85.00 & 2.50% \\ R & $63.50 & 5.00% \end{tabular} American Airlines' 2010 Insurance Renewal 1 The underlying principle of insurance markets is that premiums paid by many cover losses suffered by a few. Commercial aircraft insurance resembles automobile insurance in that the policies cover collision and liability associated with accidents. However, compared with automobile insurance, commercial aircraft insurance can involve huge sums for each accident. Consequently, airline insurance contracts are typically syndicated, with insurance for a single carrier divided among several insurers. Airlines' insurance contracts are typically renewed annually with rates reflecting the current safety data as well as competitive market conditions. In this exercise, we will look at the 2010 insurance renewal decision for American (AMR Corporation). American is based in Fort Worth, Texas and is one of the world's largest airlines, operating extensively in the U.S. and internationally. The 2010 renewal decision was particularly interesting because American considered several contracts with self-insurance features. The insurance would cover both American's flagship airline American Airlines and its regional subsidiary American Eagle for the period from July 2010 to July 2011. The 2010 Renewal Process The renewal process starts with American issuing a "renewal submission" that is circulated to possible insurers. The submission describes American's fleet of aircraft (types of planes, values of planes, etc.) as well as forecasts of their usage (number of flights flown, passengers carried, etc.) in the coming year. This data is shown in Tables 1 and 2. Table 1: Fleet information (in service planes only) 2 1This case was developed by Jim Smith at the Fuqua School of Business, Duke University in 2015 using data provided by Franc Hangarter, Managing Director of Corporate Insurance and Risk Management at American Airlines and Peter Warlick (Fuqua '94), Vice President and Treasurer of American Airlines. This revision was prepared in April, 2016. The model in this case was developed solely for this exercise and does not reflect the views of American Airlines or any of the insurers named in the case. 2 For this exercise, you should assume that all planes of a given type have the same value and the same number of seats. The actual values and number of seats may vary by plane, even for the same type of plane. 2 Table 2; Fleet activity forecasts After reviewing this data and their models, the insurers submit offers to provide coverage. The offers are described by a "100\% premium" which represents a price to insure the whole fleet (American Airlines and American Eagle) and a "bound share" which represents the maximum fraction of the fleet that the insurer is willing to insure at this price. These offers are shown in Table 3. For confidentiality reasons, the names of the insurers have been disguised and are referred to as Insurers A-R. Many of the world's largest insurance and reinsurance companies, including Allianz, Munich Re, Swiss Re, SCOR and Partner Re are active in this market. The market also includes more specialized firms that focus on aviation insurance, like Chartis Aviation, La Reunion Aerienne, and Global Aerospace. To understand the offers shown in Table 3, consider Insurer E. Insurer E has offered a 100\% premium of $62.50 and is willing to take up to 15% of American's fleet at this price. If American selects Insurer E as an underwriter and takes the full 15% share, American would pay Insurer E a premium equal to $62.50 million 15%=$9.38 million. As is evident in Table 3 , there is substantial variation in both the premiums and the bound shares proposed by the insurers. All other things equal, American would simply sort by the offer prices and take the lowest offer prices until they reach 100% coverage, perhaps taking less than the full bound share for the last insurer included. In the event of a loss, the selected insurers would pay in proportion to their allotted share. For example, if American experienced a $23 million loss and Insurer E had a 15% share, Insurer E would be obligated to pay $23 million 15%=$3.45 million. In the 2010 offering, two insurers - insurers S and J - offered contracts (in addition to the contracts in Table 3) with self-insurance features. Specifically, - Insurer S offered a contract with a 100% premium of $36 million and "self-insurance retention" (SIR) of $50 million, with a 2% bound share; - Insurer J offered a contract with a 100% premium of $64.50 million and a SIR of $15 million, with a 5% bound share. To limit its exposure, Insurer J required American to choose between its contract with self-insurance and its standard contract shown in Table 3; that is, American could take at most one of the two contracts offered by Insurer J. The SIR is essentially a deductible on annual losses. The bound share works in the same way as the standard contracts. If American chooses Insurer S's contract with self-insurance at the full 2% share, American would pay Insurer S a premium equal to $36 million 2%=$0.72 million. In the event of losses, the SIR would be deducted from the amount of the loss before figuring Insurer S's share of the losses for this contract. If American loses less than $50 million over the course of the year, Insurer S would pay nothing on this contract. If, however, American suffered losses totaling more than $50 million in a year, Insurer $ would pay 2% of the losses in excess of the $50 million SIR. For example, if American lost $78 million over the course of the year, Insurer $ would pay American (\$78 million - $50 million )2%=$0.56 million. American would be responsible for the amount below the SIR, $50 million 2%=$1.0 million. Thus, the contracts with self-insurance offer American a lower premium while providing coverage for large losses, at the expense of leaving American with some exposure to losses. Table 4 illustrates how the insurance calculations would work in several loss scenarios in the case where American has both self-insurance contracts. Here we consider a low scenario with losses of $4 million, a "typical" scenario with losses of $23 million and a high scenario with losses of $78 million. Note that the standard insurance contracts are sorted by their 100% Premium in this table to make it easy to see which contracts would be selected. Note that with this plan, American takes just 0.75% from Insurer M, though Insurer M has offered to take up to 2%. Table 5 shows the insurance calculations in the same loss scenarios in the case where American does not take any contracts with self-insurance. Here note that Insurer M now takes a full 2% share and Insurer J and Insurer G also take shares. Modeling Losses Many insurance contracts are priced based on experience ratings, where projected losses are based on the average of past losses, perhaps adjusted for time trends and the profile of the particular party insured. In this setting, such a practice might suggest a rule of the form, say, a 100% premium equal to $0.70 per passenger boarded. However, such an approach may be problematic for aviation insurance where losses are rare and can be catastrophic and, moreover, the safety and liability environments are changing over time. For these reasons, past experience may not be a very good predictor of future losses. Moreover, such simple rules of thumb are not very helpful when evaluating more complex contracts, such as those with self-insurance features. Table 4: Costs in various loss scenarios if American has both self-insurance contracts. Table 5: Costs in various loss scenarios if American has no self-insurance contracts. To understand the tradeoffs between the standard contract and those with the self-insurance features, we have to consider the likelihood of suffering losses of various magnitudes. Losses can be categorized into three main categories: 3 - Attritional losses are losses due to damage to an aircraft that can be repaired, so the aircraft is not declared a total loss. Such a loss may arise from, for example, a food service truck striking a plane wing or fuselage or two planes' wings bumping while taxiing on the runway. Such losses occur infrequently, but are much more frequent than the other categories of losses considered. - Hull losses are major accidents that "total" the aircraft. These occur with major plane crashes and sometimes with hard landings or runway excursions that do not result in any fatalities. - Liability associated with the loss of life or injury sustained by passengers or crew in the event of a serious accident. Liabilities due to people on the ground - for injury or loss of life or property damage - are also included in this category. To get a sense of the kinds of losses encountered and their frequencies, you can review the "Statistical Summary of Commercial Jet Airplane Accidents," published annually by Boeing. 4 Accident Rates: Accident rates are typically quoted in terms of accidents per million departures, as the vast majority of accidents occur during take-off or landing or the associated ascent or descent. Attritional losses typically occur during taxi or when loading or unloading the plane. Figure 1 shows how accident rates have changed since the early 1960s. As is evident in the figure, commercial air travel has become incredibly safe over the last few decades. An airline like American - operating modern aircraft in well-regulated regions - probably has even better rates than the industry averages shown in the figure: Boeing's worldwide averages include many planes that are older than American's and are operating under less safe conditions. Figure 1: Accident rates and onboard fatalities by year, worldwide commercial jet fleet, 1959-2009. (from Boeing's "Statist ical Summary of Commercial Jet Airplane Accidents," July 2009) "These coverages exclude "war risks" (war, hijacking and "other perils" including terrorism) which are covered in a separate contract and different market. 4 Available at http://www.boeing.comews/techissues/pdf/statsum. pdt. Despite these advances in safety, losses may occur and to evaluate insurance policies, we need to think about accident rates. For the purposes of this exercise, assume: - Hull loss accidents with fatalities occur at a rate of 0.15 accidents per million flights. 5 - Hull loss accidents without fatalities occur at a rate of 0.17 accidents per million flights. These rates can be compared to worldwide averages of 0.42 and 0.37 in the 2009 Boeing statistical summary. These rates are hard to estimate and different insurers may make different assumptions about these rates (as well as other assumptions in the loss model). This is one of the reasons for the variations in the offers shown in Table 3. To simplify the model, you may also assume: - All hull loss accidents result in 100% loss of the value of the plane. - Each American Airline plane has the same number of departures. - Each American Eagle plane has the same number of departures. The total number of departures for American Airlines and American Eagle are shown in Table 2. Liability Losses: Although plane travel has grown much safer in recent years, from the insurer's perspective, this increase in safety has been partially offset by increasing awards to accident victims. Before 1999, international treaties (dating back to the Warsaw Convention of 1929) limited airlines' exposure in order to foster growth of the commercial airline industry. However, the 1999 Montreal Convention treaty removed all limits on personal liability. In practice, the damages awarded will vary by jurisdiction and the specific passenger involved. This makes liability losses resulting from fatal accidents difficult to predict and model: there is uncertainty about the number of people lost in the accident, the damage to people and property not on the aircraft, about the settlement or court awards to those injured or killed (or their families or estates) in an accident, as well as how liability might be shared with other parties (e.g., airline manufacturers). Rather than model all of the uncertainties associated with liability separately, we will simplify things for this exercise by modeling the average liability per seat (passengers + crew) on the aircraft. Specifically, assume that: - No liability is incurred in accidents without fatalities. - In the event of a fatal accident, the liability per seat on the aircraft involved is log-normally distributed with mean of $1.9 million and standard deviation of $2.0 million. (Location = 0 ) The log-normal distribution is widely used in situations where the possible values are bounded on the left (typically by 0 ) and positively skewed, meaning there is some chance of large positive values. Here the liability could be quite large depending on the nature of the accident. 5 To put this rate into perspective, if someone were to take one flight per day, the expected time before being involved in a fatal accident is 18,264 vears. Moreover, on average, half of all passengers involved in fatal accidents survive, so the expected time before this frequent flyer would be killed in a fatal accident would be approximately 36,500 years. Attritional Losses: Finally, we have to consider attritional losses. Rather than model the occurrence of individual accidents, because attritional losses are more frequent and better understood, we will simply estimate the total attritional losses for the American Airlines and American Eagle fleets based on past experience. You may assume: - The total attritional losses for American Airlines is log-normally distributed with mean $4.5 million and standard deviation $2.0 million. (Location =0 ) - The total attritional losses for American Eagle is log-normally distributed with mean $3.8 million and standard deviation $2.0 million. (Location =0 ) The log-normal distribution is used here for the same reasons it was used in modeling liability above: the losses are bounded below by zero and are positively skewed because there could be several large attritional losses in a given year. Loss Calculator: Table 6 shows an example loss scenario for the year. This example is purely illustrative: it is extremely unlikely that American would experience this many major accidents in one year. In this scenario, there are 3 hull loss accidents with fatalities, 2 involving B737s and 1 involving an E140. In addition, there are 2 hull loss accidents without fatalities, involving a B777 and a CRJ. The hull losses shown in Table 6 reflect the number of accidents and the values of the planes lost. The attritional losses shown in Table 6 are randomly generated figures, drawn from the distributions described above. For the liability calculations, there are "per seat" liability cells for up to 5 fatal accidents per plane type," but only the values corresponding to the actual number of fatal accidents are used. The logic for these calculations is determined by the "Include in total?" columns: these cells are 1 if the indicated accident occurred and zero otherwise. For example, for the per seat liability losses of $959k and $2.387M are used for the 2 B737 fatal accidents, respectively, and the $939k per seat liability is used for the E140 fatal accident. These per-seat liabilities were randomly generated from the distributions described above. The per-seat liabilities costs for the other aircraft types are not relevant in this scenario and are not included in the total liability (e.g., there are no losses of B757s in this scenario). The worksheet "Table 6 (Loss calculations)" in Excel model does the calculations shown in Table 6, using this scenario shown in Table 6 as a base case. You need to add appropriate CB assumptions to this worksheet to model the uncertainties about the various losses (as described above) and link this model to the insurance calculations to evaluate different insurance plans. 6 The cutoff of 5 is quite conservative: the probability having 6 or more fatal accidents of one plane type is extremely small. Questions: Define the total cost associated with an insurance plan (i.e., a set of policies providing 100% coverage for American's fleet) to be the total premiums paid plus American's share of the losses for any plan that includes some element of self-insurance. 1. Evaluate American's total costs and exposure to risks for four plans: (i) with both Insurers S and J 's contracts with self-insurance; (ii) with Insurer S's contract with self-insurance, but not Insurer J's contract with selfinsurance; (iii) with Insurer J's contract with self-insurance, but not Insurer S's contract; and (iv) with just the available insurance contracts that do not have self-insurance features. Build an overlay chart comparing the cumulative distributions for the total costs for each plan and show the statistics (mean, standard deviation, etc.) for the total costs for each plan. Which plan do you recommend and why? 2. Though hull and attritional losses may be substantial, a large carrier like American could probably absorb such losses without seriously disrupting its operations. On the other hand, the liabilities associated with a major accident involving many fatalities could easily amount to hundreds of millions in losses (or more) and bankrupt even a large carrier. With this in mind, suppose that American could obtain a policy from another insurer (or group of insurers) that offers full coverage of all liability losses, but no coverage of hull or attritional losses. Based on recent bids for similar plans, American's insurance brokers estimate they can obtain full "liability only" coverage for a premium of $45 million. For this part of the exercise, compare the following options for American: (i) The plan from part 1 (i), including both S and J 's contracts with self-insurance. (ii) Liability only coverage. (iii) Full self-insurance, i.e., no coverage from any insurer. (American was not considering this, but this option provides a relevant benchmark.) Which of these options would you recommend American pursue and why? Provide overlay charts and statistics (as in part 1) to support your answer. Table 6: Loss calculator \begin{tabular}{ccc} UnderwritingCompany & 100%Premium & BoundShare \\ \hline A & $65.00 & 12.50% \\ B & $64.00 & 8.00% \\ C & $65.00 & 2.50% \\ D & $69.00 & 7.00% \\ E & $62.50 & 15.00% \\ F & $62.00 & 5.00% \\ G & $80.00 & 5.00% \\ H & $62.00 & 3.50% \\ I & $59.50 & 13.00% \\ J & $79.50 & 5.00% \\ K & $62.11 & 2.00% \\ L & $67.50 & 3.75% \\ M & $75.00 & 2.00% \\ N & $62.00 & 2.00% \\ O & $66.75 & 10.00% \\ P & $62.00 & 3.00% \\ Q & $85.00 & 2.50% \\ R & $63.50 & 5.00% \end{tabular}
Step by Step Solution
There are 3 Steps involved in it
Step: 1

Get Instant Access to Expert-Tailored Solutions
See step-by-step solutions with expert insights and AI powered tools for academic success
Step: 2

Step: 3
Ace Your Homework with AI
Get the answers you need in no time with our AI-driven, step-by-step assistance
Get Started
Audit Renaissance
Authors: Vakils
1st Edition
8184621639, 978-8184621631