Answered step by step
Verified Expert Solution
Link Copied!

Question

1 Approved Answer

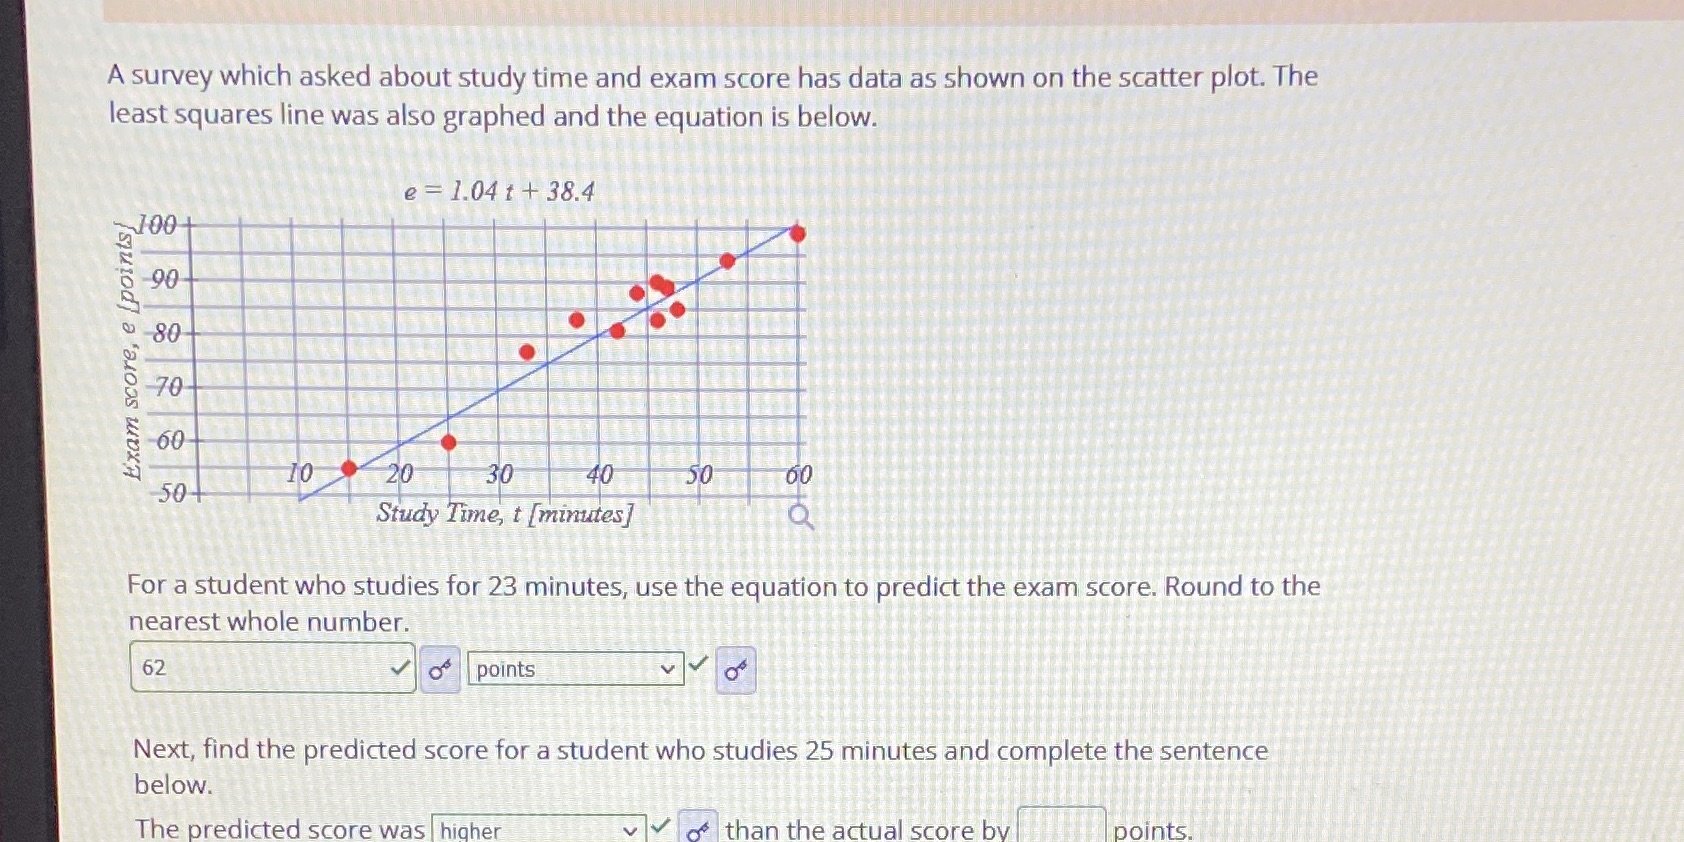
Please help me on this A survey which asked about study time and exam score has data as shown on the scatter plot. The least

Please help me on this

image text in transcribed
A survey which asked about study time and exam score has data as shown on the scatter plot. The least squares line was also graphed and the equation is below. e = 1.04 1 + 38.4 100 Exam score, e [points 70 60 10 20 30 40 SO 504 Study Time, t [minutes] For a student who studies for 23 minutes, use the equation to predict the exam score. Round to the nearest whole number. 62 points Next, find the predicted score for a student who studies 25 minutes and complete the sentence below. The predicted score was higher than the actual score by points

Step by Step Solution

There are 3 Steps involved in it

Step: 1

blur-text-image

Get Instant Access to Expert-Tailored Solutions

See step-by-step solutions with expert insights and AI powered tools for academic success

Step: 2

blur-text-image

Step: 3

blur-text-image

Ace Your Homework with AI

Get the answers you need in no time with our AI-driven, step-by-step assistance

Get Started

Recommended Textbook for

Applied Calculus

Authors: Stefan Waner, Steven Costenoble

7th Edition

1337514306, 9781337514309

More Books

Students also viewed these Mathematics questions