Answered step by step
Verified Expert Solution
Question
1 Approved Answer
Please help me out with this LBO modeling example! Please answer only the highlighted cells. thanks so much! hope that's more clear. only fill the
Please help me out with this LBO modeling example! Please answer only the highlighted cells. thanks so much! 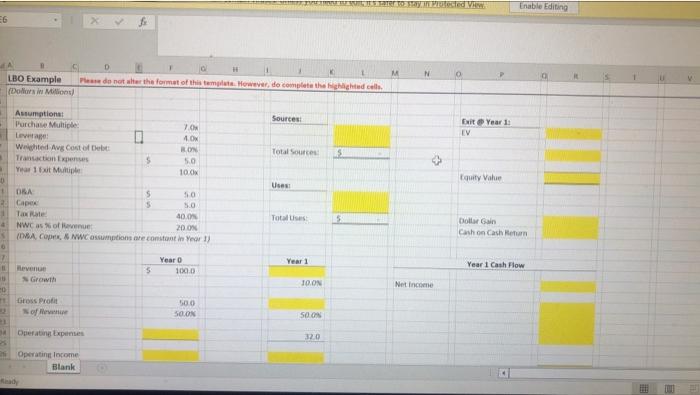

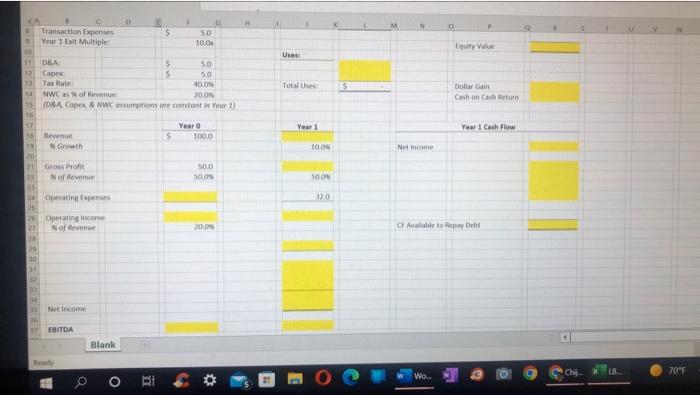
hope that's more clear. only fill the highlighted portion 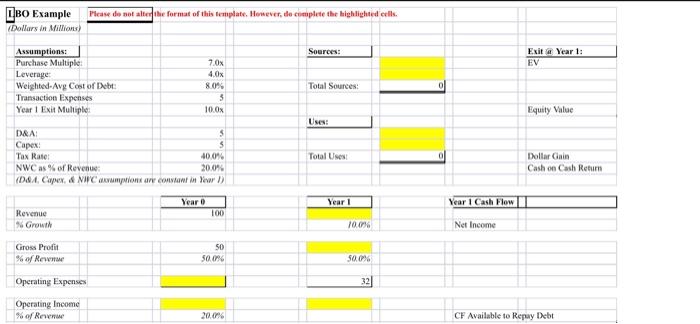
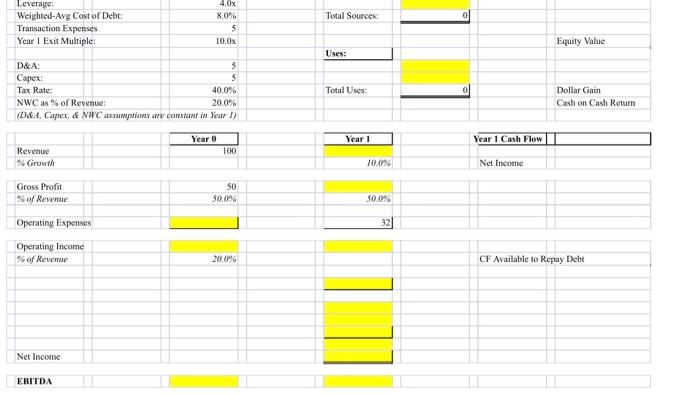
6 D Please do not alter the format of this template. However, do complete the highlighted cells. LBO Example (Dollars in Millions) Assumptions: Sources: Purchase Multiple: 7.0 Leverage: 4.0x Weighted Avg Cost of Debt: 8.0% Total Sources: 5 Transaction Expenses $ 5.0 B Year 1 Exit Multiple 10.00 D Uses: 1 DRA $ 500 2 Capex 5.0 Tax Rate 40.0% Total Uses NWC as % of Revenue: 20.0% S (D&A, Copex, & NWC assumptions are constant in Year 1) 6 7 Year O Year 1 11 Revenue 100.0 20 50.0 50.0% m 12 13 24 % Growth Gross Profit LINDEBE SUIT JE Ster to stay in Protected View. % of Revenue Operating Expenses Operating Income Blank 10.0% 50.0% 32.0 Net Income Enable Editing Exit Year 1: EV Equity Value Dollar Gain Cash on Cash Return Year 1 Cash Flow [1] 11 Transaction Expenses 5 5.0 " Year 1 Exit Multiple: 10.0 10 11 DRA 5 5.0 12 Capes $ 5.0 13 Tax Rate: 40.0% 14 NWC as % of Revenue 20.0% 15 (D&A Capex, & NWC assumptions are constant in Year 1) 16 17 Year 0 18 Revenue $ 100.0 19 N-Growth 20 21 Gross Profit 221 N of Revenue 24 Operating Expenses 25 26 Operating Income 27 of Revenue 31 32 REAARI 33 34 15 Net Income EBITDA Ready Blank O F 50.0 50.0% 20.0% Uses Total Uses Year 1 100% 30.08 5 Equity Value Dollar Gain Cash on Cash Return Year 1 Cash Flow Net Income CF Available to Repay Debt Wo.. Chi LB... 70F IBO Example Please do not alter the format of this template. However, do complete the highlighted cells. (Dollars in Millions) Assumptions: Sources: Purchase Multiple: 7,0x Leverage: 4.0x Weighted-Avg Cost of Debt: Total Sources: Transaction Expenses Year 1 Exit Multiple: Uses: D&A: Capex: 5 Tax Rate: 40,0% Total Uses NWC as % of Revenue: 20.0% (D&A, Capex, & NWC assumptions are constant in Year 1) Year 0 Revenue 100 % Growth Gross Profit 50 % of Revenue 50.0% Operating Expenses Operating Income % of Revenue 20.0% 8.0% 5 10.0x 5 Year 1 10.0% 50.0% 32 Exit@Year 1: EV Equity Value Dollar Gain. Cash on Cash Return Year 1 Cash Flow Net Income CF Available to Repay Debt 4.0x 8.0% 5 10.0x 5 Leverage: Weighted-Avg Cost of Debt: Transaction Expenses Year 1 Exit Multiple: D&A: Capex: Tax Rate: 40.0% NWC as % of Revenue: 20.0% (D&A, Capex, & NWC assumptions are constant in Year 1) Year 0 100 Revenue % Growth Gross Profit 50 % of Revenue 50.0% Operating Expenses Operating Income % of Revenue 20.0% Net Income EBITDA 5 Total Sources: Uses: Total Uses: Year 1 10.0% 50.0% 32 0 Equity Value Dollar Gain Cash on Cash Return Year 1 Cash Flow Net Income CF Available to Repay Debt 6 D Please do not alter the format of this template. However, do complete the highlighted cells. LBO Example (Dollars in Millions) Assumptions: Sources: Purchase Multiple: 7.0 Leverage: 4.0x Weighted Avg Cost of Debt: 8.0% Total Sources: 5 Transaction Expenses $ 5.0 B Year 1 Exit Multiple 10.00 D Uses: 1 DRA $ 500 2 Capex 5.0 Tax Rate 40.0% Total Uses NWC as % of Revenue: 20.0% S (D&A, Copex, & NWC assumptions are constant in Year 1) 6 7 Year O Year 1 11 Revenue 100.0 20 50.0 50.0% m 12 13 24 % Growth Gross Profit LINDEBE SUIT JE Ster to stay in Protected View. % of Revenue Operating Expenses Operating Income Blank 10.0% 50.0% 32.0 Net Income Enable Editing Exit Year 1: EV Equity Value Dollar Gain Cash on Cash Return Year 1 Cash Flow [1] 11 Transaction Expenses 5 5.0 " Year 1 Exit Multiple: 10.0 10 11 DRA 5 5.0 12 Capes $ 5.0 13 Tax Rate: 40.0% 14 NWC as % of Revenue 20.0% 15 (D&A Capex, & NWC assumptions are constant in Year 1) 16 17 Year 0 18 Revenue $ 100.0 19 N-Growth 20 21 Gross Profit 221 N of Revenue 24 Operating Expenses 25 26 Operating Income 27 of Revenue 31 32 REAARI 33 34 15 Net Income EBITDA Ready Blank O F 50.0 50.0% 20.0% Uses Total Uses Year 1 100% 30.08 5 Equity Value Dollar Gain Cash on Cash Return Year 1 Cash Flow Net Income CF Available to Repay Debt Wo.. Chi LB... 70F IBO Example Please do not alter the format of this template. However, do complete the highlighted cells. (Dollars in Millions) Assumptions: Sources: Purchase Multiple: 7,0x Leverage: 4.0x Weighted-Avg Cost of Debt: Total Sources: Transaction Expenses Year 1 Exit Multiple: Uses: D&A: Capex: 5 Tax Rate: 40,0% Total Uses NWC as % of Revenue: 20.0% (D&A, Capex, & NWC assumptions are constant in Year 1) Year 0 Revenue 100 % Growth Gross Profit 50 % of Revenue 50.0% Operating Expenses Operating Income % of Revenue 20.0% 8.0% 5 10.0x 5 Year 1 10.0% 50.0% 32 Exit@Year 1: EV Equity Value Dollar Gain. Cash on Cash Return Year 1 Cash Flow Net Income CF Available to Repay Debt 4.0x 8.0% 5 10.0x 5 Leverage: Weighted-Avg Cost of Debt: Transaction Expenses Year 1 Exit Multiple: D&A: Capex: Tax Rate: 40.0% NWC as % of Revenue: 20.0% (D&A, Capex, & NWC assumptions are constant in Year 1) Year 0 100 Revenue % Growth Gross Profit 50 % of Revenue 50.0% Operating Expenses Operating Income % of Revenue 20.0% Net Income EBITDA 5 Total Sources: Uses: Total Uses: Year 1 10.0% 50.0% 32 0 Equity Value Dollar Gain Cash on Cash Return Year 1 Cash Flow Net Income CF Available to Repay Debt 

Step by Step Solution
There are 3 Steps involved in it
Step: 1

Get Instant Access to Expert-Tailored Solutions
See step-by-step solutions with expert insights and AI powered tools for academic success
Step: 2

Step: 3

Ace Your Homework with AI
Get the answers you need in no time with our AI-driven, step-by-step assistance
Get Started


