Answered step by step
Verified Expert Solution
Link Copied!

Question

1 Approved Answer

Please help me solve the following questions. Thanks 8 Construct a tally table, a frequency table, a relative frequency table, a percentage taste for the

Please help me solve the following questions. Thanks
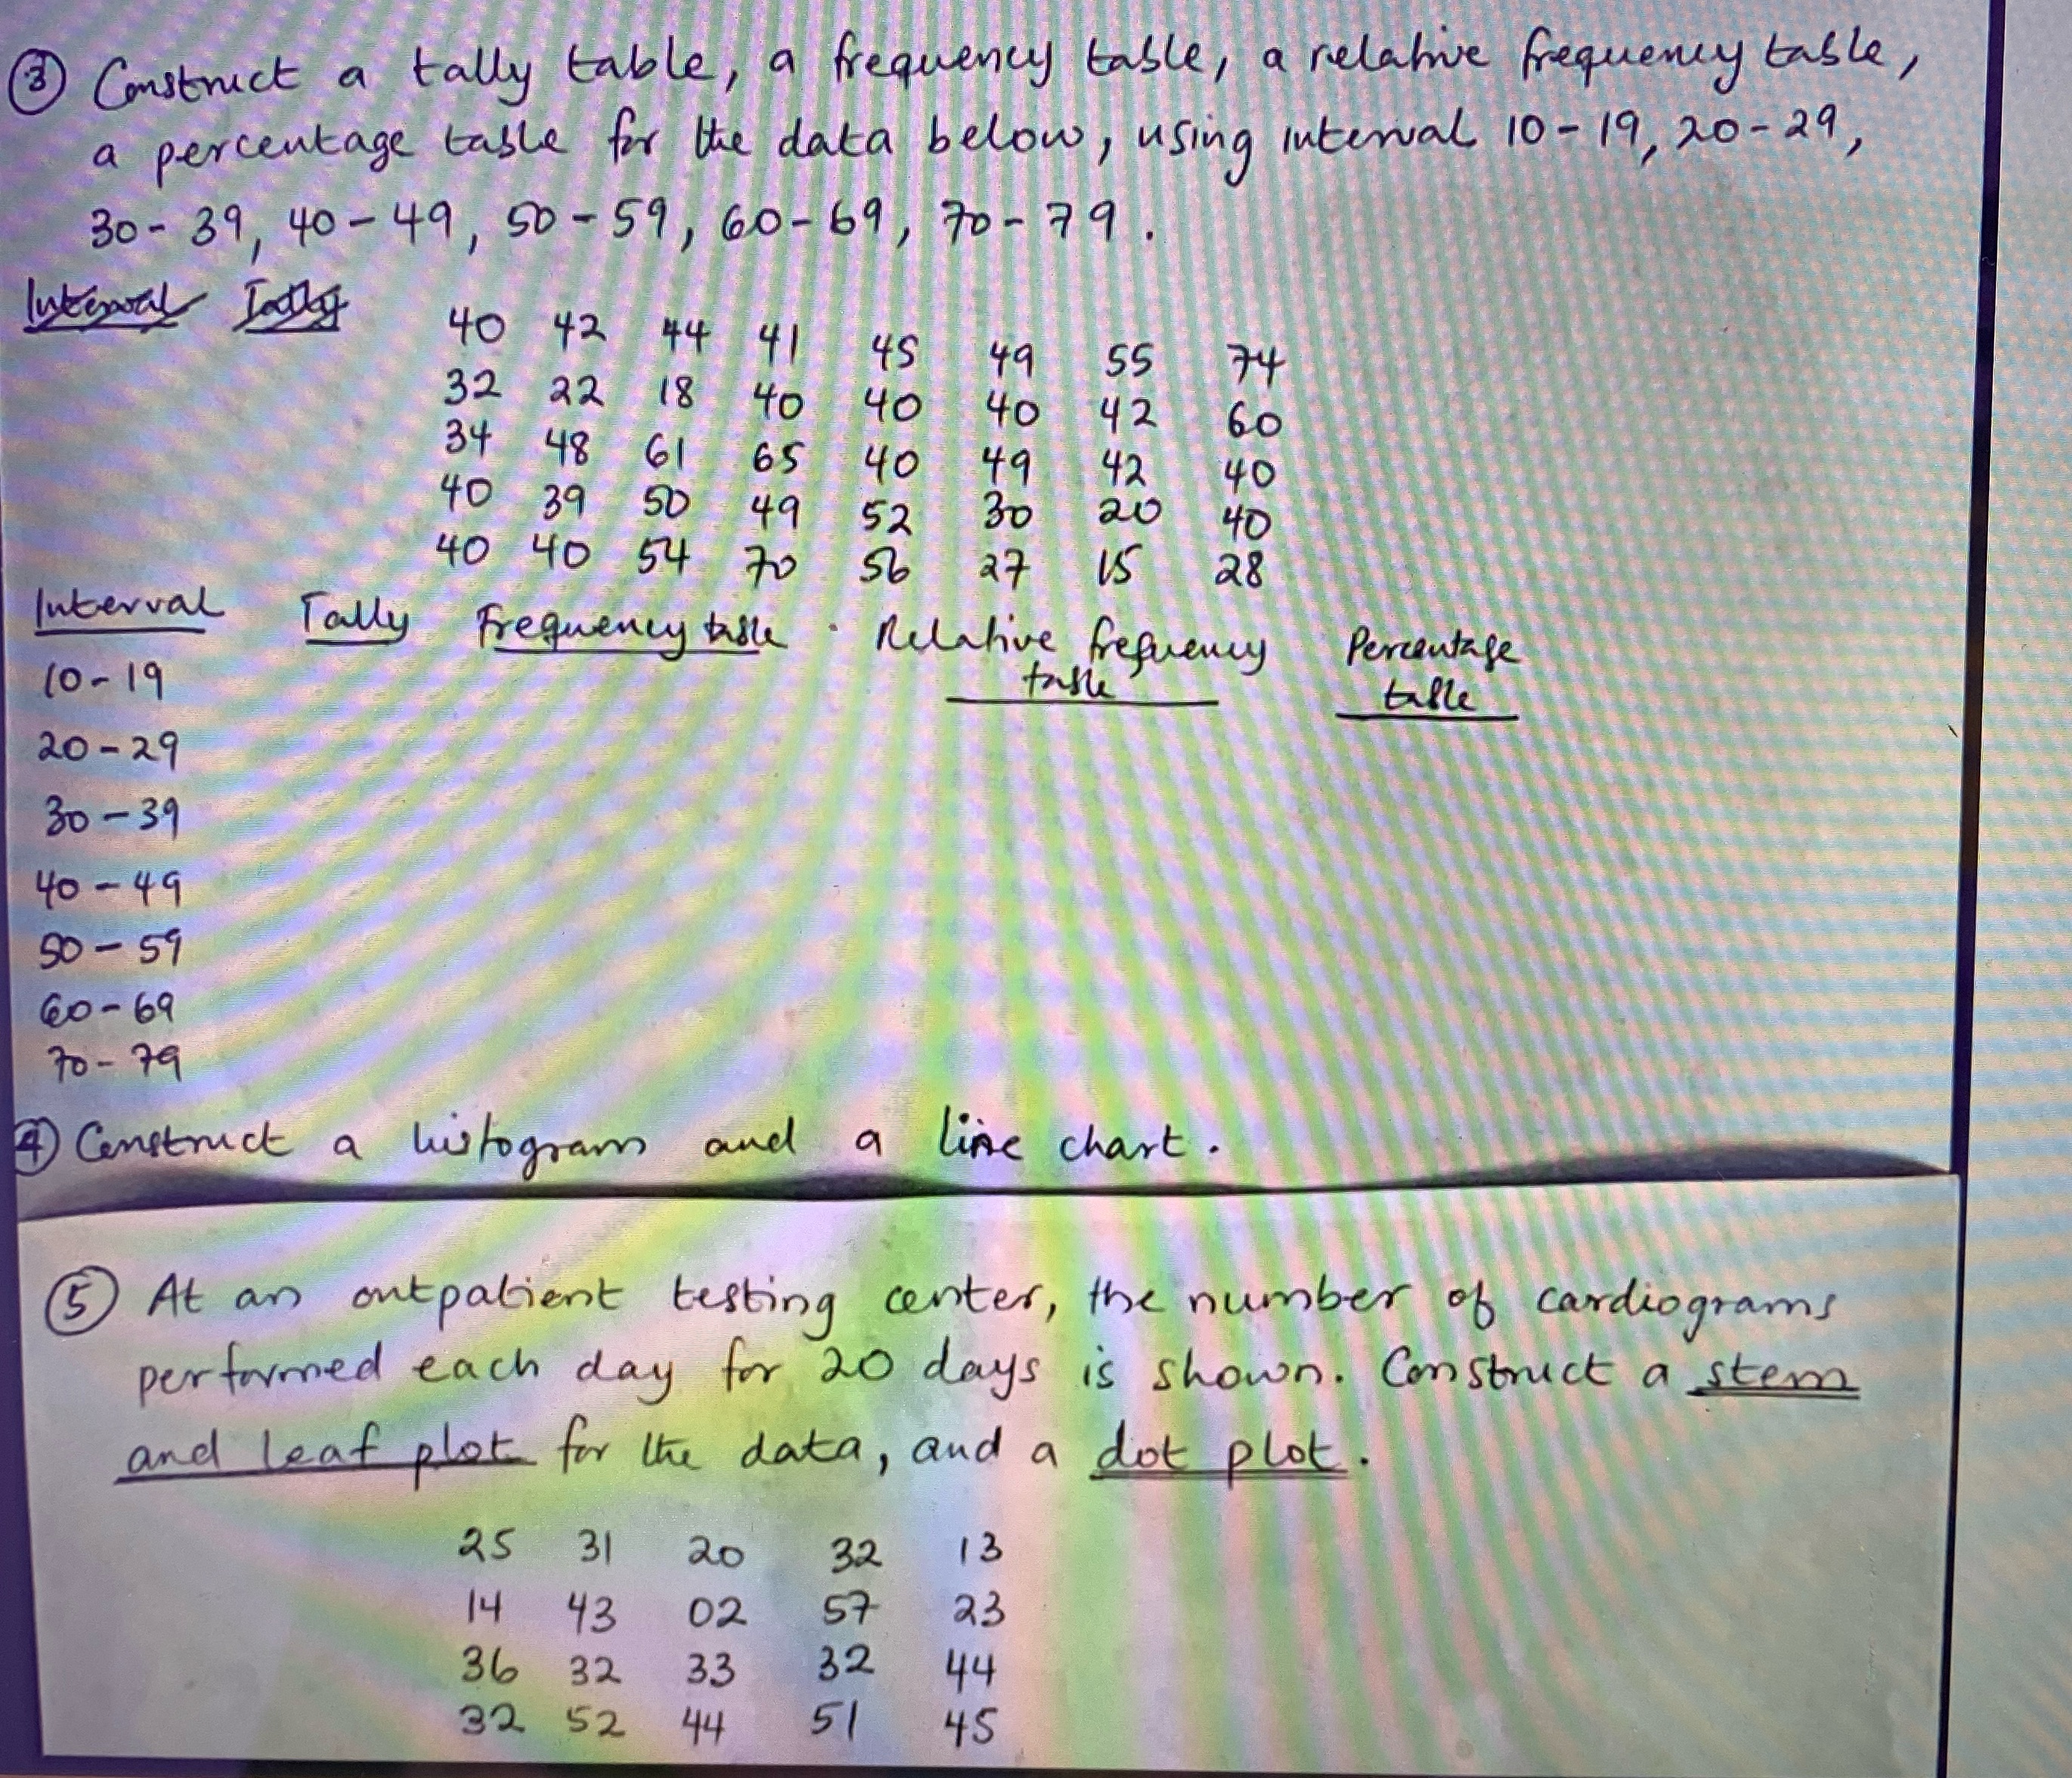
image text in transcribed
8 Construct a tally table, a frequency table, a relative frequency table, a percentage taste for the data below, using interval 10- 19, 20-29, 30- 39, 40 - 49, 50- 59, 60- 69, 70 - 79 lukegoal Tally 40 42 44 41 45 49 55 174 32 22 18 40 40 34 48 + 61 65 40 49 140 42 60 40 39 50 49 142 30 40 20 40 40 54 70 56 27 15 40 Interval 28 10- 19 Tally Frequency broke . Relative frequency Percentage tille ! 20- 29 30-39 40 - 49 50 - 59 20 - 69 70- 79 4) Construct a histogram and a line chart. (5) At an outpatient testing center, the number of cardiograms performed each day for 20 days is shown. Construct a stem and leaf plot for the data, and a dot plot. 25 31 20 32 13 14 43 02 57 23 36 32 33 32 44 32 52 44 51 45

Step by Step Solution

There are 3 Steps involved in it

Step: 1

blur-text-image

Get Instant Access to Expert-Tailored Solutions

See step-by-step solutions with expert insights and AI powered tools for academic success

Step: 2

blur-text-image

Step: 3

blur-text-image

Ace Your Homework with AI

Get the answers you need in no time with our AI-driven, step-by-step assistance

Get Started

Recommended Textbook for

Differential Equations and Linear Algebra

Authors: Jerry Farlow, James E. Hall, Jean Marie McDill, Beverly H. West

2nd edition

131860615, 978-0131860612

More Books

Students also viewed these Mathematics questions

Question

Describe the three main roles of law in our society.

Answered: 1 week ago

Question

Is it fair? Will my action unfairly discriminate against anyone?

Answered: 1 week ago