

Answered step by step
Verified Expert Solution
Question
1 Approved Answer
PLEASE Help me solve this home work with JAVA language and NetBeans app , I only have 5 hours left before the dead line .
PLEASE Help me solve this home work with JAVA language and NetBeans app , I only have 5 hours left before the dead line . 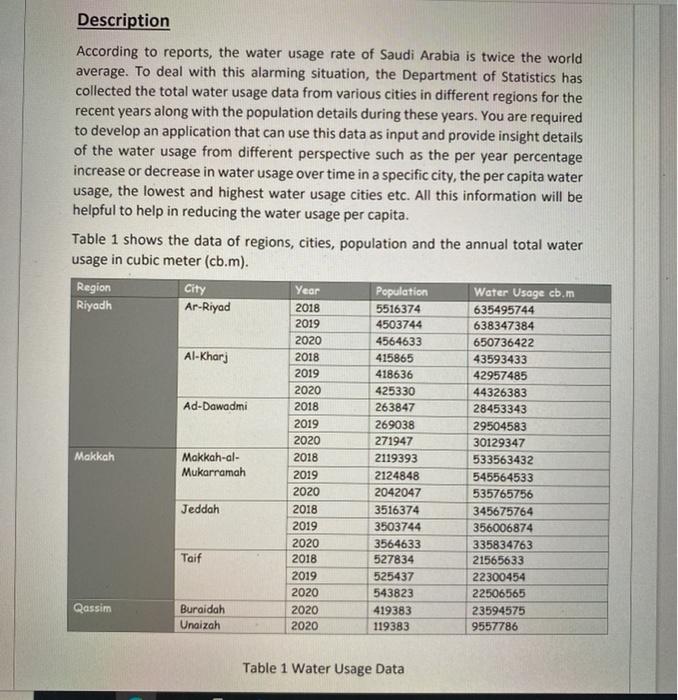
This is all the information I have
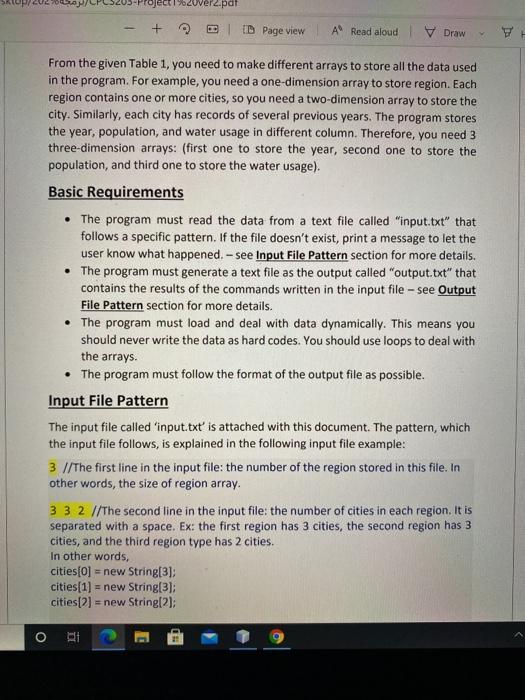
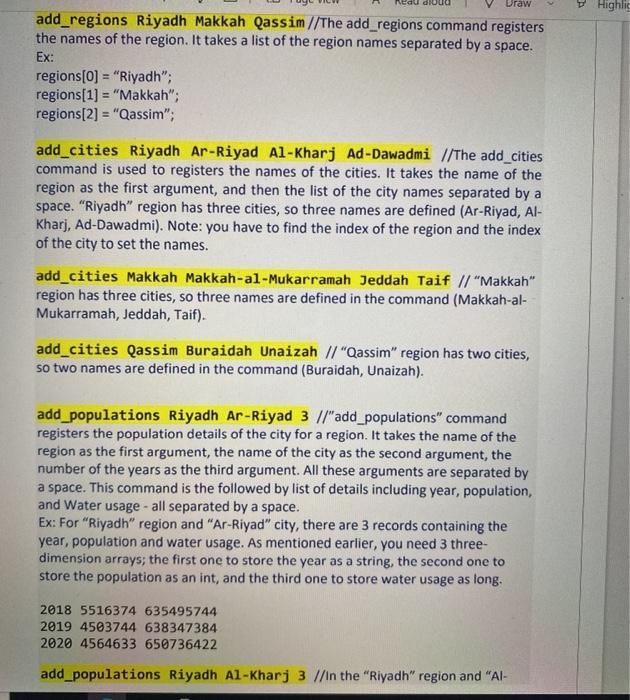
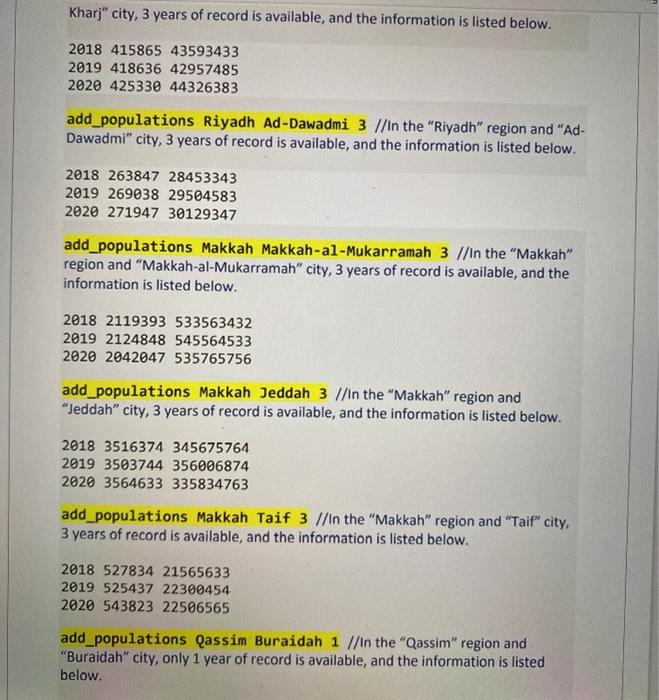
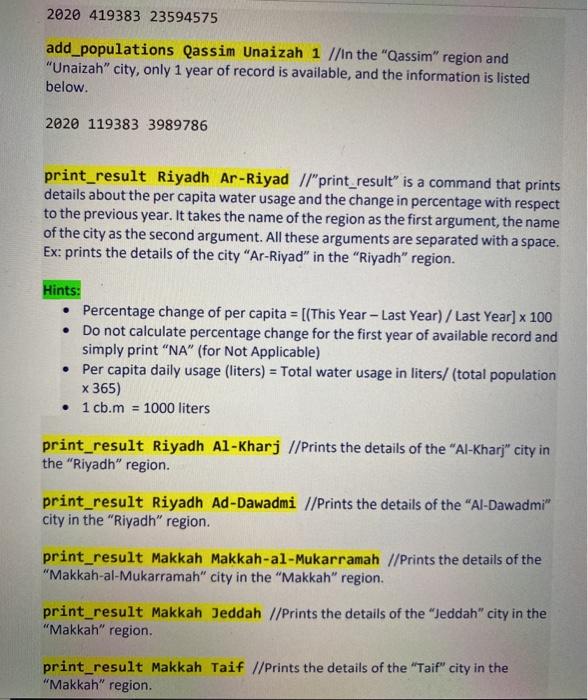
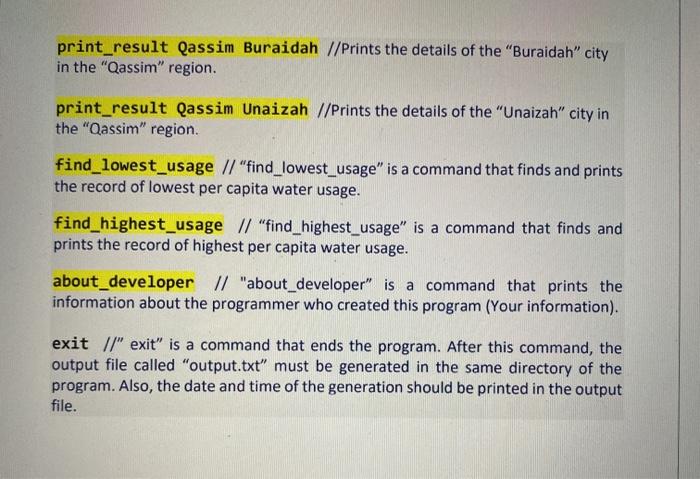
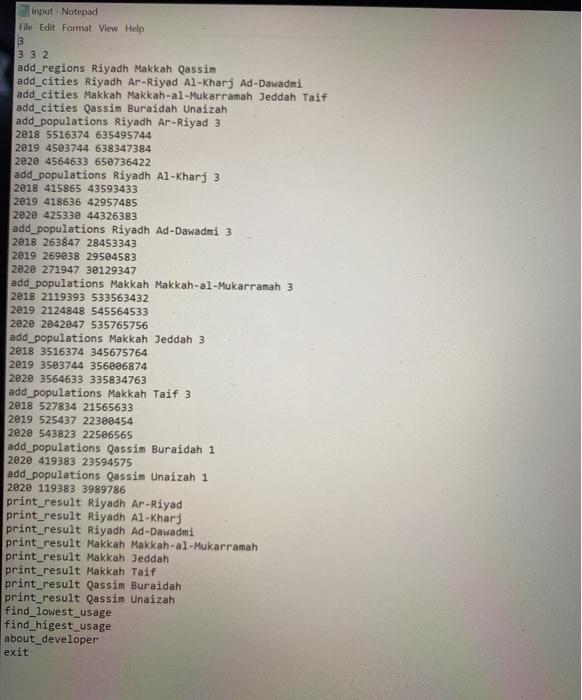
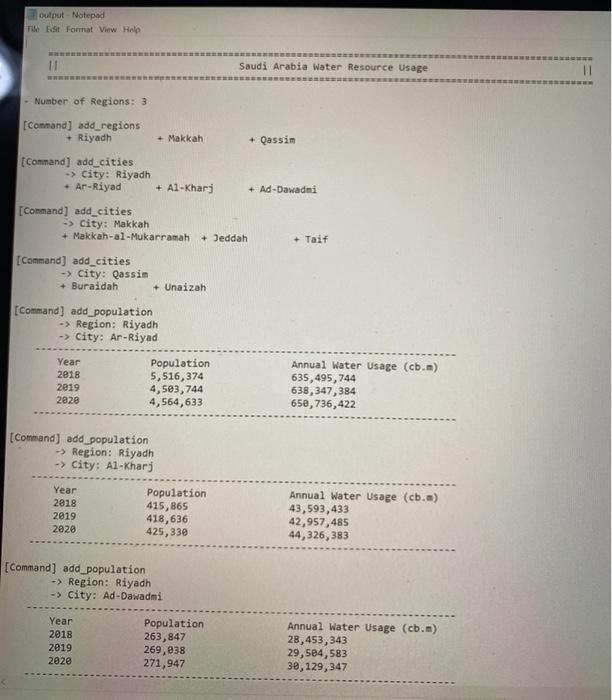
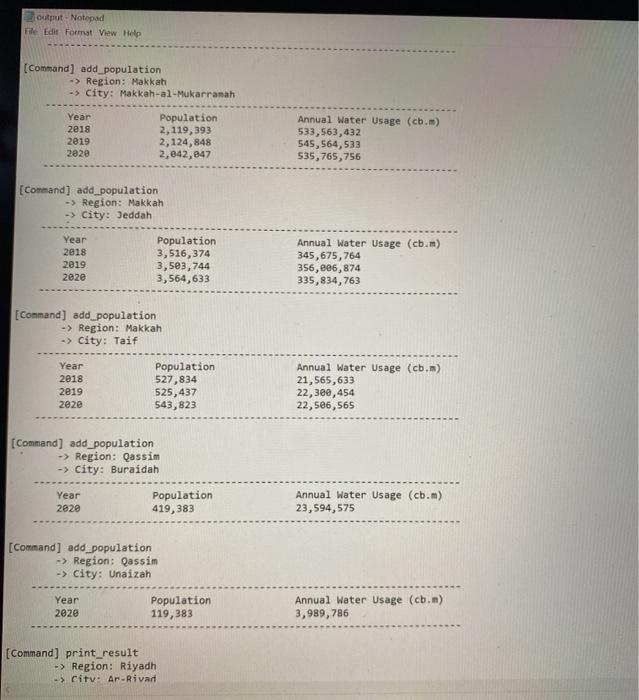
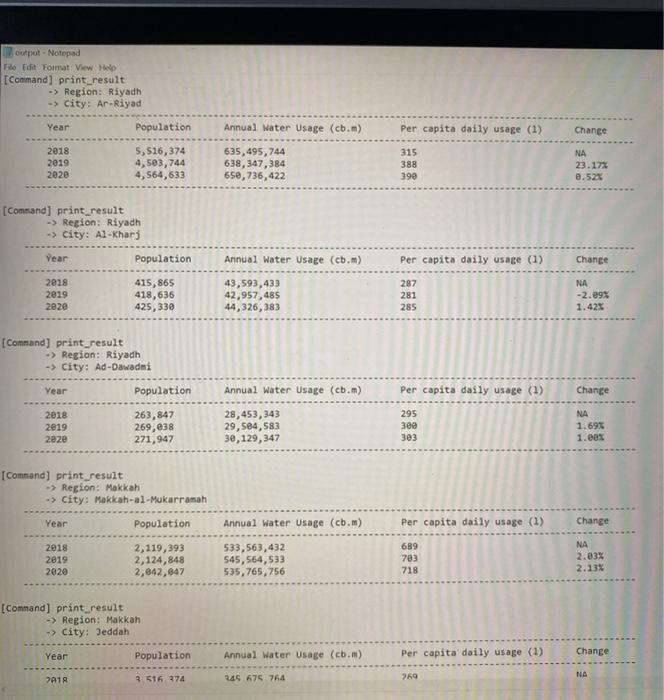
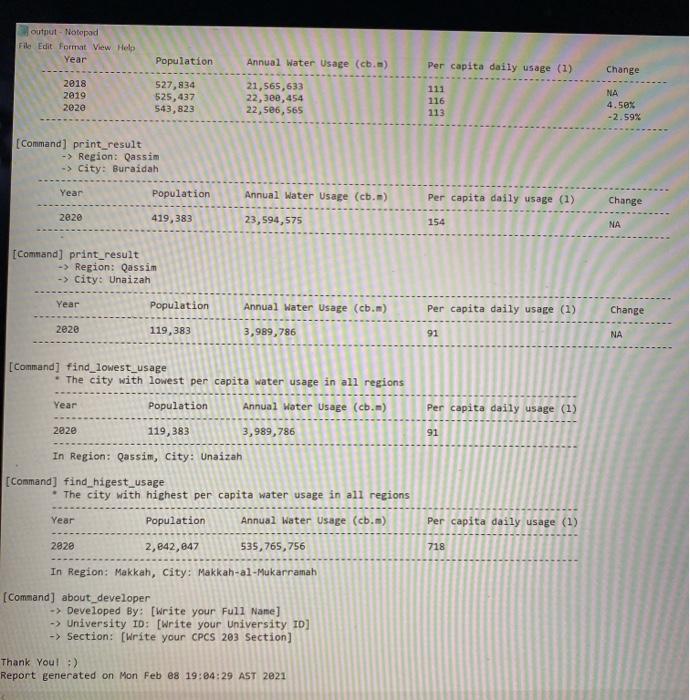
Description According to reports, the water usage rate of Saudi Arabia is twice the world average. To deal with this alarming situation, the Department of Statistics has collected the total water usage data from various cities in different regions for the recent years along with the population details during these years. You are required to develop an application that can use this data as input and provide insight details of the water usage from different perspective such as the per year percentage increase or decrease in water usage over time in a specific city, the per capita water usage, the lowest and highest water usage cities etc. All this information will be helpful to help in reducing the water usage per capita. Table 1 shows the data of regions, cities, population and the annual total water usage in cubic meter (cb.m). Region City Year Population Water Usage cb.m Riyadh Ar-Riyad 2018 5516374 635495744 2019 4503744 638347384 2020 4564633 650736422 Al-Kharj 2018 415865 43593433 2019 418636 42957485 2020 425330 44326383 Ad-Dawadmi 2018 263847 28453343 2019 269038 29504583 2020 271947 30129347 Makkah Makkah-al- 2018 2119393 533563432 Mukarramah 2019 2124848 545564533 2020 2042047 535765756 Jeddah 2018 3516374 345675764 2019 3503744 356006874 2020 3564633 335834763 Taif 2018 527834 21565633 2019 525437 22300454 2020 543823 22506565 Qassim Buraidah 2020 419383 23594575 Unaizah 2020 119383 9557786 Table 1 Water Usage Data C%20verz.par + 9 ID Page view A Read aloud Draw From the given Table 1, you need to make different arrays to store all the data used in the program. For example, you need a one-dimension array to store region. Each region contains one or more cities, so you need a two-dimension array to store the city. Similarly, each city has records of several previous years. The program stores the year, population, and water usage in different column. Therefore, you need 3 three-dimension arrays: (first one to store the year, second one to store the population, and third one to store the water usage). Basic Requirements The program must read the data from a text file called "input.txt" that follows a specific pattern. If the file doesn't exist, print a message to let the user know what happened. - see Input File Pattern section for more details. . The program must generate a text file as the output called "output.txt" that contains the results of the commands written in the input file - see Output File Pattern section for more details. The program must load and deal with data dynamically. This means you should never write the data as hard codes. You should use loops to deal with the arrays. The program must follow the format of the output file as possible. Input File Pattern The input file called input.txt' is attached with this document. The pattern, which the input file follows, is explained in the following input file example: 3 //The first line in the input file: the number of the region stored in this file. In other words, the size of region array. 3 3 2 //The second line in the input file: the number of cities in each region. It is separated with a space. Ex: the first region has 3 cities, the second region has 3 cities, and the third region type has 2 cities. In other words, cities[0] = new String[3]; cities[1] = new String(3); cities[2] = new String(2); O BE neau du Draw Highlig add_regions Riyadh Makkah Qassim//The add_regions command registers the names of the region. It takes a list of the region names separated by a space. Ex: regions[0] = "Riyadh"; regions[1] = "Makkah"; regions[2] = "Qassim"; add_cities Riyadh Ar-Riyad Al-Kharj Ad-Dawadmi //The add_cities command is used to registers the names of the cities. It takes the name of the region as the first argument, and then the list of the city names separated by a space. "Riyadh" region has three cities, so three names are defined (Ar-Riyad, Al- Kharj, Ad-Dawadmi). Note: you have to find the index of the region and the index of the city to set the names. add_cities Makkah Makkah-al-Mukarramah Jeddah Taif // "Makkah region has three cities, so three names are defined in the command (Makkah-al- Mukarramah, Jeddah, Taif). add_cities Qassim Buraidah Unaizah // "Qassim" region has two cities, so two names are defined in the command (Buraidah, Unaizah). add_populations Riyadh Ar-Riyad 3 //"add_populations" command registers the population details of the city for a region. It takes the name of the region as the first argument, the name of the city as the second argument, the number of the years as the third argument. All these arguments are separated by a space. This command is the followed by list of details including year, population, and Water usage - all separated by a space. Ex: For "Riyadh" region and "Ar-Riyad" city, there are 3 records containing the year, population and water usage. As mentioned earlier, you need 3 three- dimension arrays; the first one to store the year as a string, the second one to store the population as an int, and the third one to store water usage as long. 2018 5516374 635495744 2019 4503744 638347384 2020 4564633 650736422 add_populations Riyadh Al-Kharj 3 //In the "Riyadh" region and "Al- Kharj" city, 3 years of record is available, and the information is listed below. 2018 415865 43593433 2019 418636 42957485 2020 425330 44326383 add_populations Riyadh Ad-Dawadmi 3 //In the "Riyadh" region and "Ad- Dawadmi" city, 3 years of record is available, and the information is listed below. 2018 263847 28453343 2019 269038 29504583 2020 271947 30129347 add_populations Makkah Makkah-al-Mukarramah 3 //In the "Makkah" region and "Makkah-al-Mukarramah" city, 3 years of record is available, and the information is listed below. 2018 2119393 533563432 2019 2124848 545564533 2020 2042047 535765756 add_populations Makkah Jeddah 3 //In the "Makkah" region and "Jeddah" city, 3 years of record is available, and the information is listed below. 2018 3516374 345675764 2019 3503744 356006874 2020 3564633 335834763 add_populations Makkah Taif 3 //In the "Makkah" region and "Taif" city, 3 years of record is available, and the information is listed below. 2018 527834 21565633 2019 525437 22300454 2020 543823 22506565 add_populations Qassim Buraidah 1 //In the "Qassim" region and "Buraidah" city, only 1 year of record is available, and the information is listed below. 2020 419383 23594575 add_populations Qassim Unaizah 1 //In the "Qassim" region and "Unaizah" city, only 1 year of record is available, and the information is listed below. 2020 119383 3989786 print_result Riyadh Ar-Riyad //"print_result" is a command that prints details about the per capita water usage and the change in percentage with respect to the previous year. It takes the name of the region as the first argument, the name of the city as the second argument. All these arguments are separated with a space. Ex: prints the details of the city "Ar-Riyad" in the "Riyadh" region. Hints: Percentage change of per capita = [(This Year - Last Year) / Last Year] x 100 Do not calculate percentage change for the first year of available record and simply print "NA" (for Not Applicable) Per capita daily usage (liters) = Total water usage in liters/ (total population x 365) 1 cb.m = 1000 liters print_result Riyadh Al-Kharj //Prints the details of the "Al-Kharj" city in the "Riyadh" region. print_result Riyadh Ad-Dawadmi //Prints the details of the "Al-Dawadmi" city in the "Riyadh" region. print_result Makkah Makkah-al-Mukarramah //Prints the details of the "Makkah-al-Mukarramah" city in the "Makkah" region. print_result Makkah Jeddah //Prints the details of the "Jeddah" city in the "Makkah" region. print_result Makkah Taif //Prints the details of the "Taif" city in the "Makkah" region print_result Qassim Buraidah //Prints the details of the "Buraidah" city in the "Qassim" region. print_result Qassim Unaizah //Prints the details of the "Unaizah" city in the "Qassim" region. find_lowest_usage // "find_lowest_usage" is a command that finds and prints the record of lowest per capita water usage. find_highest_usage // "find_highest_usage is a command that finds and prints the record of highest per capita water usage. about_developer // "about_developer" is a command that prints the information about the programmer who created this program (Your information). exit //" exit" is a command that ends the program. After this command, the output file called "output.txt" must be generated in the same directory of the program. Also, the date and time of the generation should be printed in the output file. input Notepad File Edit Format View Help 3 13 32 add_regions Riyadh Makkah Qassim add_cities Riyadh Ar-Riyad Al-Kharj Ad-Dawadni add_cities Makkah Makkah-al-Mukarramah Jeddah Taif add_cities Qassim Buraidah Unaizah add_populations Riyadh Ar-Riyad 3 2018 5516374 635495744 2019 4503744 638347384 2e2e 4564633 658736422 add_populations Riyadh Al-Kharj 3 2018 415865 43593433 2019 418636 42957485 2eze 425330 44326383 add_populations Riyadh Ad-Dawadmi 3 2018 263847 28453343 2019 269238 29504583 2020 271947 30129347 add_populations Makkah Makkah-al-Mukarramah 3 2018 2119393 533563432 2019 2124848 545564533 2020 2842847 535765756 add_populations Makkah Jeddah 3 2018 3516374 345675764 2019 3583744 356006874 2820 3564633 335834763 add_populations Makkah Taif 3 2018 527834 21565633 2019 525437 22388454 2e2e 543823 22506565 add_populations Qassim Buraidah 1 2020 419383 23594575 add_populations Qassim Unaizah 1 2020 119383 3989786 print_result Riyadh Ar-Riyad print_result Riyadh Al-Kharj print_result Riyadh Ad-Dawadmi print_result Makkah Makkah-al-Mukarramah print_result Makkah Jeddah print_result Makkah Taif print_result Qassim Buraidah print_result Qassim Unaizah find_lowest_usage find_higest_usage about_developer exit output Notepad File Format View Help 11 Saudi Arabia Water Resource Usage - Number of Regions: 3 [Command) add_regions + Riyadh + Makkah + Qassim [Command) add_cities -> City: Riyadh - Ar-Riyad + Al-Khari + Ad-Dawadni [Command) add_cities -> City: Makkah + Makkah-al-Mukarramah + Jeddah +Taif [Command) add_cities -> City: Qassim + Buraidah + Unaizah [Command) add_population -> Region: Riyadh -> City: Ar-Riyad Year 2018 2019 2020 Population 5,516,374 4,5e3,744 4,564,633 Annual Water Usage (cb.m) 635,495,744 638, 347, 384 650,736,422 [Command) add_population -> Region: Riyadh -> City: Al-Kharj Year 2018 2019 2028 Population 415,865 418,636 425,330 Annual Water Usage (cb.n) 43,593,433 42,957,485 44,326,383 [Command] add_population -> Region: Riyadh -> City: Ad-Dawadni Year 2018 2019 2020 Population 263,847 269,838 271,947 Annual Water Usage (cb.m) 28,453, 343 29,504,583 38,129,347 Out Notepad File Edit Format View Help [Command) add_population -> Region: Makkah -> City: Makkah-al-Mukarramah Year 2018 2019 282e Population 2,119,393 2,124,848 2,842,047 Annual Water Usage (cb.) 533,563,432 545,564,533 535, 765,756 [Command) add_population -> Region: Makkah -> City: Jeddah Year 2018 2019 2020 Population 3,516,374 3,5e3, 744 3,564,633 Annual Water Usage (cb.m) 345,675, 764 356,286,874 335,834,763 [Command) add_population -> Region: Makkah -> City: Taif Year 2018 2019 2e2e Population 527,834 525,437 543,823 Annual Water Usage (cb.n) 21,565,633 22,300,454 22,586,565 [Command] add_population -> Region: Qassim -> City: Buraidah Year 2020 Population 419,383 Annual Water Usage (cb.m) 23,594,575 [Command] add_population -> Region: Qassim -> City: Unaizah Year Population 2020 119,383 Annual Water Usage (cb.m) 3,989, 786 [Command) print_result -> Region: Riyadh -> City. Ar-Rivad output - Notepad File Edit Format View [Command) print_result -> Region: Riyadh -> City: Ar-Riyad Year Population Annual Water Usage (cb.) Per capita daily usage (1) Change 2018 2019 2020 5,516,374 4,503, 744 4,564,633 635,495,744 638,347,384 650,736,422 315 388 390 NA 23.17% 8.52% [Command] print_result -> Region: Riyadh -> City: Al-Kharj Year Population Annual Water Usage (cb.m) Per capita daily usage (1) Change 2018 2019 2020 415,865 418,636 425,330 43,593,433 42,957,485 44,326,383 287 281 285 NA -2.09% 1.42% [Command] print_result -> Region: Riyadh -> City: Ad-Dawadmi Year Population Per capita daily usage (1) Change 2018 2019 2e2e 263, 847 269,038 271,947 Annual Water Usage (cb.m) 28,453,343 29,584,583 38, 129, 347 295 300 303 NA 1.69% 1.00% [Command) print_result -> Region: Makkah -> City: Mokkah-al-Mukarrasah Year Population Annual Water Usage (cb.m) Per capita daily usage (1) Change 2018 2019 2020 2,119,393 2,124,848 2,842,847 533,563,432 545,564,533 535,765,756 689 783 718 NA 2.03% 2.13% [Command] print_result -> Region: Makkah -> City: Jeddah Year Population Annual Water Usage (cb.m) Per capita daily usage (1) Change NA 2A1R 3 516 374 769 245 675 764 outnut - Notepad File Edit Format View Help Year Population Annual Water Usage (cb.m) Per capita daily usage (1) Change 111 2018 2019 2020 527,834 525,437 543,823 21,565,633 22,300,454 22,586,565 116 NA 4.58% -2.59% 113 [Command) print_result -> Region: Qassim -> City: Buraidah Year Population Annual Water Usage (cb..) Per capita daily usage (1) Change 2e2e 419,383 23,594,575 154 NA [Command] print_result -> Region: Qassim -> City Unaizah Year Population Per capita daily usage (1) Change Annual Water Usage (cb.n) 3,989,786 2020 119,383 91 NA [Command] find_lowest_usage . The city with lowest per capita water usage in all regions Year Population Annual Water Usage (cb..) Per capita daily usage (1) 2020 119,383 3,989,786 91 In Region: Qassim, City: Unaizah [Command] find_higest_usage The city with highest per capita water usage in all regions Year Population Annual Water Usage (cb.m) 2828 2,842,047 535,765,756 Per capita daily usage (1) 718 In Region: Makkah, City: Makkah-al-Mukarramah [Command) about developer -> Developed By: [Write your Full Name] -> University ID: [Write your University ID] -> Section: [Write your CPCS 203 Section) Thank You! :) Report generated on Mon Feb 08 19:04:29 AST 2021 Description According to reports, the water usage rate of Saudi Arabia is twice the world average. To deal with this alarming situation, the Department of Statistics has collected the total water usage data from various cities in different regions for the recent years along with the population details during these years. You are required to develop an application that can use this data as input and provide insight details of the water usage from different perspective such as the per year percentage increase or decrease in water usage over time in a specific city, the per capita water usage, the lowest and highest water usage cities etc. All this information will be helpful to help in reducing the water usage per capita. Table 1 shows the data of regions, cities, population and the annual total water usage in cubic meter (cb.m). Region City Year Population Water Usage cb.m Riyadh Ar-Riyad 2018 5516374 635495744 2019 4503744 638347384 2020 4564633 650736422 Al-Kharj 2018 415865 43593433 2019 418636 42957485 2020 425330 44326383 Ad-Dawadmi 2018 263847 28453343 2019 269038 29504583 2020 271947 30129347 Makkah Makkah-al- 2018 2119393 533563432 Mukarramah 2019 2124848 545564533 2020 2042047 535765756 Jeddah 2018 3516374 345675764 2019 3503744 356006874 2020 3564633 335834763 Taif 2018 527834 21565633 2019 525437 22300454 2020 543823 22506565 Qassim Buraidah 2020 419383 23594575 Unaizah 2020 119383 9557786 Table 1 Water Usage Data C%20verz.par + 9 ID Page view A Read aloud Draw From the given Table 1, you need to make different arrays to store all the data used in the program. For example, you need a one-dimension array to store region. Each region contains one or more cities, so you need a two-dimension array to store the city. Similarly, each city has records of several previous years. The program stores the year, population, and water usage in different column. Therefore, you need 3 three-dimension arrays: (first one to store the year, second one to store the population, and third one to store the water usage). Basic Requirements The program must read the data from a text file called "input.txt" that follows a specific pattern. If the file doesn't exist, print a message to let the user know what happened. - see Input File Pattern section for more details. . The program must generate a text file as the output called "output.txt" that contains the results of the commands written in the input file - see Output File Pattern section for more details. The program must load and deal with data dynamically. This means you should never write the data as hard codes. You should use loops to deal with the arrays. The program must follow the format of the output file as possible. Input File Pattern The input file called input.txt' is attached with this document. The pattern, which the input file follows, is explained in the following input file example: 3 //The first line in the input file: the number of the region stored in this file. In other words, the size of region array. 3 3 2 //The second line in the input file: the number of cities in each region. It is separated with a space. Ex: the first region has 3 cities, the second region has 3 cities, and the third region type has 2 cities. In other words, cities[0] = new String[3]; cities[1] = new String(3); cities[2] = new String(2); O BE neau du Draw Highlig add_regions Riyadh Makkah Qassim//The add_regions command registers the names of the region. It takes a list of the region names separated by a space. Ex: regions[0] = "Riyadh"; regions[1] = "Makkah"; regions[2] = "Qassim"; add_cities Riyadh Ar-Riyad Al-Kharj Ad-Dawadmi //The add_cities command is used to registers the names of the cities. It takes the name of the region as the first argument, and then the list of the city names separated by a space. "Riyadh" region has three cities, so three names are defined (Ar-Riyad, Al- Kharj, Ad-Dawadmi). Note: you have to find the index of the region and the index of the city to set the names. add_cities Makkah Makkah-al-Mukarramah Jeddah Taif // "Makkah region has three cities, so three names are defined in the command (Makkah-al- Mukarramah, Jeddah, Taif). add_cities Qassim Buraidah Unaizah // "Qassim" region has two cities, so two names are defined in the command (Buraidah, Unaizah). add_populations Riyadh Ar-Riyad 3 //"add_populations" command registers the population details of the city for a region. It takes the name of the region as the first argument, the name of the city as the second argument, the number of the years as the third argument. All these arguments are separated by a space. This command is the followed by list of details including year, population, and Water usage - all separated by a space. Ex: For "Riyadh" region and "Ar-Riyad" city, there are 3 records containing the year, population and water usage. As mentioned earlier, you need 3 three- dimension arrays; the first one to store the year as a string, the second one to store the population as an int, and the third one to store water usage as long. 2018 5516374 635495744 2019 4503744 638347384 2020 4564633 650736422 add_populations Riyadh Al-Kharj 3 //In the "Riyadh" region and "Al- Kharj" city, 3 years of record is available, and the information is listed below. 2018 415865 43593433 2019 418636 42957485 2020 425330 44326383 add_populations Riyadh Ad-Dawadmi 3 //In the "Riyadh" region and "Ad- Dawadmi" city, 3 years of record is available, and the information is listed below. 2018 263847 28453343 2019 269038 29504583 2020 271947 30129347 add_populations Makkah Makkah-al-Mukarramah 3 //In the "Makkah" region and "Makkah-al-Mukarramah" city, 3 years of record is available, and the information is listed below. 2018 2119393 533563432 2019 2124848 545564533 2020 2042047 535765756 add_populations Makkah Jeddah 3 //In the "Makkah" region and "Jeddah" city, 3 years of record is available, and the information is listed below. 2018 3516374 345675764 2019 3503744 356006874 2020 3564633 335834763 add_populations Makkah Taif 3 //In the "Makkah" region and "Taif" city, 3 years of record is available, and the information is listed below. 2018 527834 21565633 2019 525437 22300454 2020 543823 22506565 add_populations Qassim Buraidah 1 //In the "Qassim" region and "Buraidah" city, only 1 year of record is available, and the information is listed below. 2020 419383 23594575 add_populations Qassim Unaizah 1 //In the "Qassim" region and "Unaizah" city, only 1 year of record is available, and the information is listed below. 2020 119383 3989786 print_result Riyadh Ar-Riyad //"print_result" is a command that prints details about the per capita water usage and the change in percentage with respect to the previous year. It takes the name of the region as the first argument, the name of the city as the second argument. All these arguments are separated with a space. Ex: prints the details of the city "Ar-Riyad" in the "Riyadh" region. Hints: Percentage change of per capita = [(This Year - Last Year) / Last Year] x 100 Do not calculate percentage change for the first year of available record and simply print "NA" (for Not Applicable) Per capita daily usage (liters) = Total water usage in liters/ (total population x 365) 1 cb.m = 1000 liters print_result Riyadh Al-Kharj //Prints the details of the "Al-Kharj" city in the "Riyadh" region. print_result Riyadh Ad-Dawadmi //Prints the details of the "Al-Dawadmi" city in the "Riyadh" region. print_result Makkah Makkah-al-Mukarramah //Prints the details of the "Makkah-al-Mukarramah" city in the "Makkah" region. print_result Makkah Jeddah //Prints the details of the "Jeddah" city in the "Makkah" region. print_result Makkah Taif //Prints the details of the "Taif" city in the "Makkah" region print_result Qassim Buraidah //Prints the details of the "Buraidah" city in the "Qassim" region. print_result Qassim Unaizah //Prints the details of the "Unaizah" city in the "Qassim" region. find_lowest_usage // "find_lowest_usage" is a command that finds and prints the record of lowest per capita water usage. find_highest_usage // "find_highest_usage is a command that finds and prints the record of highest per capita water usage. about_developer // "about_developer" is a command that prints the information about the programmer who created this program (Your information). exit //" exit" is a command that ends the program. After this command, the output file called "output.txt" must be generated in the same directory of the program. Also, the date and time of the generation should be printed in the output file. input Notepad File Edit Format View Help 3 13 32 add_regions Riyadh Makkah Qassim add_cities Riyadh Ar-Riyad Al-Kharj Ad-Dawadni add_cities Makkah Makkah-al-Mukarramah Jeddah Taif add_cities Qassim Buraidah Unaizah add_populations Riyadh Ar-Riyad 3 2018 5516374 635495744 2019 4503744 638347384 2e2e 4564633 658736422 add_populations Riyadh Al-Kharj 3 2018 415865 43593433 2019 418636 42957485 2eze 425330 44326383 add_populations Riyadh Ad-Dawadmi 3 2018 263847 28453343 2019 269238 29504583 2020 271947 30129347 add_populations Makkah Makkah-al-Mukarramah 3 2018 2119393 533563432 2019 2124848 545564533 2020 2842847 535765756 add_populations Makkah Jeddah 3 2018 3516374 345675764 2019 3583744 356006874 2820 3564633 335834763 add_populations Makkah Taif 3 2018 527834 21565633 2019 525437 22388454 2e2e 543823 22506565 add_populations Qassim Buraidah 1 2020 419383 23594575 add_populations Qassim Unaizah 1 2020 119383 3989786 print_result Riyadh Ar-Riyad print_result Riyadh Al-Kharj print_result Riyadh Ad-Dawadmi print_result Makkah Makkah-al-Mukarramah print_result Makkah Jeddah print_result Makkah Taif print_result Qassim Buraidah print_result Qassim Unaizah find_lowest_usage find_higest_usage about_developer exit output Notepad File Format View Help 11 Saudi Arabia Water Resource Usage - Number of Regions: 3 [Command) add_regions + Riyadh + Makkah + Qassim [Command) add_cities -> City: Riyadh - Ar-Riyad + Al-Khari + Ad-Dawadni [Command) add_cities -> City: Makkah + Makkah-al-Mukarramah + Jeddah +Taif [Command) add_cities -> City: Qassim + Buraidah + Unaizah [Command) add_population -> Region: Riyadh -> City: Ar-Riyad Year 2018 2019 2020 Population 5,516,374 4,5e3,744 4,564,633 Annual Water Usage (cb.m) 635,495,744 638, 347, 384 650,736,422 [Command) add_population -> Region: Riyadh -> City: Al-Kharj Year 2018 2019 2028 Population 415,865 418,636 425,330 Annual Water Usage (cb.n) 43,593,433 42,957,485 44,326,383 [Command] add_population -> Region: Riyadh -> City: Ad-Dawadni Year 2018 2019 2020 Population 263,847 269,838 271,947 Annual Water Usage (cb.m) 28,453, 343 29,504,583 38,129,347 Out Notepad File Edit Format View Help [Command) add_population -> Region: Makkah -> City: Makkah-al-Mukarramah Year 2018 2019 282e Population 2,119,393 2,124,848 2,842,047 Annual Water Usage (cb.) 533,563,432 545,564,533 535, 765,756 [Command) add_population -> Region: Makkah -> City: Jeddah Year 2018 2019 2020 Population 3,516,374 3,5e3, 744 3,564,633 Annual Water Usage (cb.m) 345,675, 764 356,286,874 335,834,763 [Command) add_population -> Region: Makkah -> City: Taif Year 2018 2019 2e2e Population 527,834 525,437 543,823 Annual Water Usage (cb.n) 21,565,633 22,300,454 22,586,565 [Command] add_population -> Region: Qassim -> City: Buraidah Year 2020 Population 419,383 Annual Water Usage (cb.m) 23,594,575 [Command] add_population -> Region: Qassim -> City: Unaizah Year Population 2020 119,383 Annual Water Usage (cb.m) 3,989, 786 [Command) print_result -> Region: Riyadh -> City. Ar-Rivad output - Notepad File Edit Format View [Command) print_result -> Region: Riyadh -> City: Ar-Riyad Year Population Annual Water Usage (cb.) Per capita daily usage (1) Change 2018 2019 2020 5,516,374 4,503, 744 4,564,633 635,495,744 638,347,384 650,736,422 315 388 390 NA 23.17% 8.52% [Command] print_result -> Region: Riyadh -> City: Al-Kharj Year Population Annual Water Usage (cb.m) Per capita daily usage (1) Change 2018 2019 2020 415,865 418,636 425,330 43,593,433 42,957,485 44,326,383 287 281 285 NA -2.09% 1.42% [Command] print_result -> Region: Riyadh -> City: Ad-Dawadmi Year Population Per capita daily usage (1) Change 2018 2019 2e2e 263, 847 269,038 271,947 Annual Water Usage (cb.m) 28,453,343 29,584,583 38, 129, 347 295 300 303 NA 1.69% 1.00% [Command) print_result -> Region: Makkah -> City: Mokkah-al-Mukarrasah Year Population Annual Water Usage (cb.m) Per capita daily usage (1) Change 2018 2019 2020 2,119,393 2,124,848 2,842,847 533,563,432 545,564,533 535,765,756 689 783 718 NA 2.03% 2.13% [Command] print_result -> Region: Makkah -> City: Jeddah Year Population Annual Water Usage (cb.m) Per capita daily usage (1) Change NA 2A1R 3 516 374 769 245 675 764 outnut - Notepad File Edit Format View Help Year Population Annual Water Usage (cb.m) Per capita daily usage (1) Change 111 2018 2019 2020 527,834 525,437 543,823 21,565,633 22,300,454 22,586,565 116 NA 4.58% -2.59% 113 [Command) print_result -> Region: Qassim -> City: Buraidah Year Population Annual Water Usage (cb..) Per capita daily usage (1) Change 2e2e 419,383 23,594,575 154 NA [Command] print_result -> Region: Qassim -> City Unaizah Year Population Per capita daily usage (1) Change Annual Water Usage (cb.n) 3,989,786 2020 119,383 91 NA [Command] find_lowest_usage . The city with lowest per capita water usage in all regions Year Population Annual Water Usage (cb..) Per capita daily usage (1) 2020 119,383 3,989,786 91 In Region: Qassim, City: Unaizah [Command] find_higest_usage The city with highest per capita water usage in all regions Year Population Annual Water Usage (cb.m) 2828 2,842,047 535,765,756 Per capita daily usage (1) 718 In Region: Makkah, City: Makkah-al-Mukarramah [Command) about developer -> Developed By: [Write your Full Name] -> University ID: [Write your University ID] -> Section: [Write your CPCS 203 Section) Thank You! :) Report generated on Mon Feb 08 19:04:29 AST 2021 Step by Step Solution
There are 3 Steps involved in it
Step: 1

Get Instant Access to Expert-Tailored Solutions
See step-by-step solutions with expert insights and AI powered tools for academic success
Step: 2

Step: 3
Ace Your Homework with AI
Get the answers you need in no time with our AI-driven, step-by-step assistance
Get Started
Ai And Election 2024 How Widely Accessible A I Tools Will Shape And Fuel The Spread Of Disinformation Create Hazards To Democracy And Affect The Upcoming 2024 U S Presidential Election
Authors: Elise Dawson
1st Edition
B0CP9YH1YR, 979-8870441016